Lotus Improv on the NeXT
"Cult classic" isn't a term typically applied to software, but if it were, this would be its poster child.


It is spoken of in reverent tones, invoked like a magic spell, whispered about as one of the mythical "roads not taken" in computing history. Its proponents write glowing reports and fawning YouTube reviews, lamenting its failure in the historical marketplace, each offering some justification for it not having set the world ablaze. It is safe to say, the legend of Lotus Improv persists to this day.
If we put ourselves in Steve Jobs's shoes circa 1988, it's easy to see why he would have been smitten by an early preview of what we now call a "pivot table." NeXT was struggling to find its market, and exclusives which justified a system purchase were sorely needed. "Maybe Improv can do for NeXT what VisiCalc did for the Apple II," must surely have crossed Jobs's mind. In making it a NeXT exclusive, Improv seemed to be a clear-eyed, forward-looking answer to the question dogging the company, posed by the inaugural issue of NeXTWORLD Magazine, "Why NeXT?"
Both NeXT and Improv brought innovative solutions to their respective computing questions of the day. NeXT made UNIX palatable to those scared of the terminal, debuted Display Postscript on a mega-pixel display, and made development for the system a snap. Improv rethought multi-dimensional data modeling, offered English-like formulas, and made it easy to rearrange data views on a whim.
The bones of both remain to this day. NeXT's operating system, NeXTSTEP / OPENSTEP, morphed into macOS, and by extension iOS. Lotus abandoned Improv fairly quickly, but a quick survey of today's spreadsheets shows a universal embrace of pivot tables.
Even today, it feels like nothing else, and still does data tricks no other spreadsheet can do as elegantly. Given its mythos, I feel a kind of nerd obligation to love it.
And yet...
Historical Context
Today's Rig
- Previous v4.4 on Windows 11
- NeXTstation Turbo
- 68040 CPU (variable clock rate; ~40 - 50Mhz)
- 128MB RAM
- 2GB hard drive
- Monochrome "Megapixel" display
- NeXTSTEP 3.3
- Lotus Improv Rel 1.0 (v108r0)
Let's Get to Work
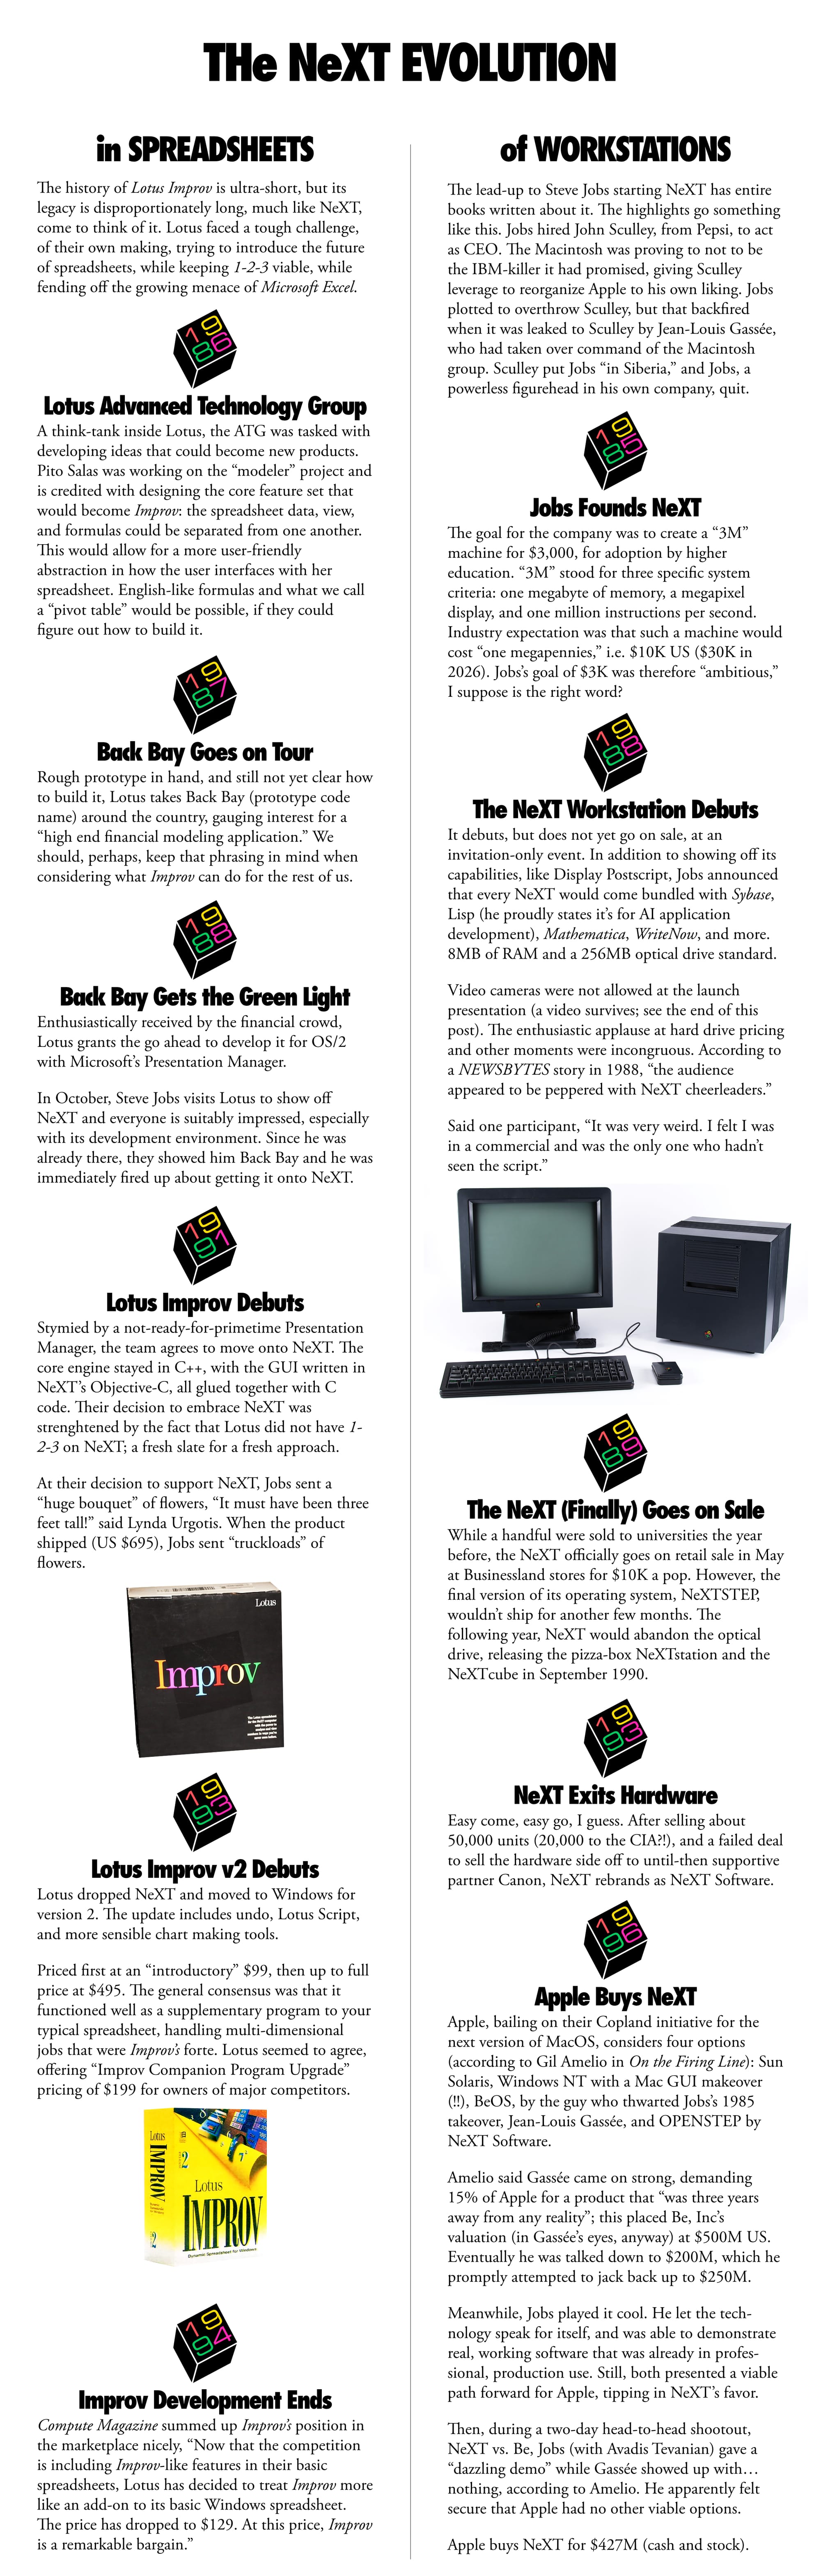
Events have converged to make this the right time to finally talk about Lotus Improv. First, it is time once again for "International Spreadsheet Day." Second, as Improv was initially a NeXT exclusive, it seems only appropriate to take a look at that machine here on the 15th (!) anniversary of the passing of Steve Jobs. Third, and not to toot my own horn too loudly, it is the 1st anniversary of this very blog.
Lotus Improv was one of four pieces of software I had in mind when deciding to start Stone Tools. In fact, it was quite literally the software that first triggered the thought, "I wish I had a place to talk about stuff like this." Deluxe Paint, the first post, was also one of those four. There are two yet to go; place your bets.
The trouble was, while I knew Deluxe Paint intimately and could jump right in, I simply had no real experience with other categories of productivity software. It would have been impossible to judge Improv fairly without first getting better acquainted with the landscape into which it was born. So, I bided my time.
Boy, howdy, do I want to impress upon you the superhuman restraint I've exhibited in waiting a full year to examine Improv.

I think we all understand Improv, being a spreadsheet, knows how to calculate sums and transcendentals and other mathematical goodness. "It does math!" is not a particularly compelling justification for its existence, nor to support its claim as the "NeXT generation of spreadsheets." Instead, let's get to know it by studying examples which show off its unique strengths, and with the suggestion of the book Improv 2.1 Revealed! we'll model up some good ole' American baseball, a game I love and understand completely.
NXIsle

Industry historians are far more capable of discussing the exile and homecoming of one Mr. Steven Paul Jobs back to Apple. I touched on the TL;DR of it in the timeline, and if you're really clamoring for juicy tidbits, a book was published this very year that delivers on that front.
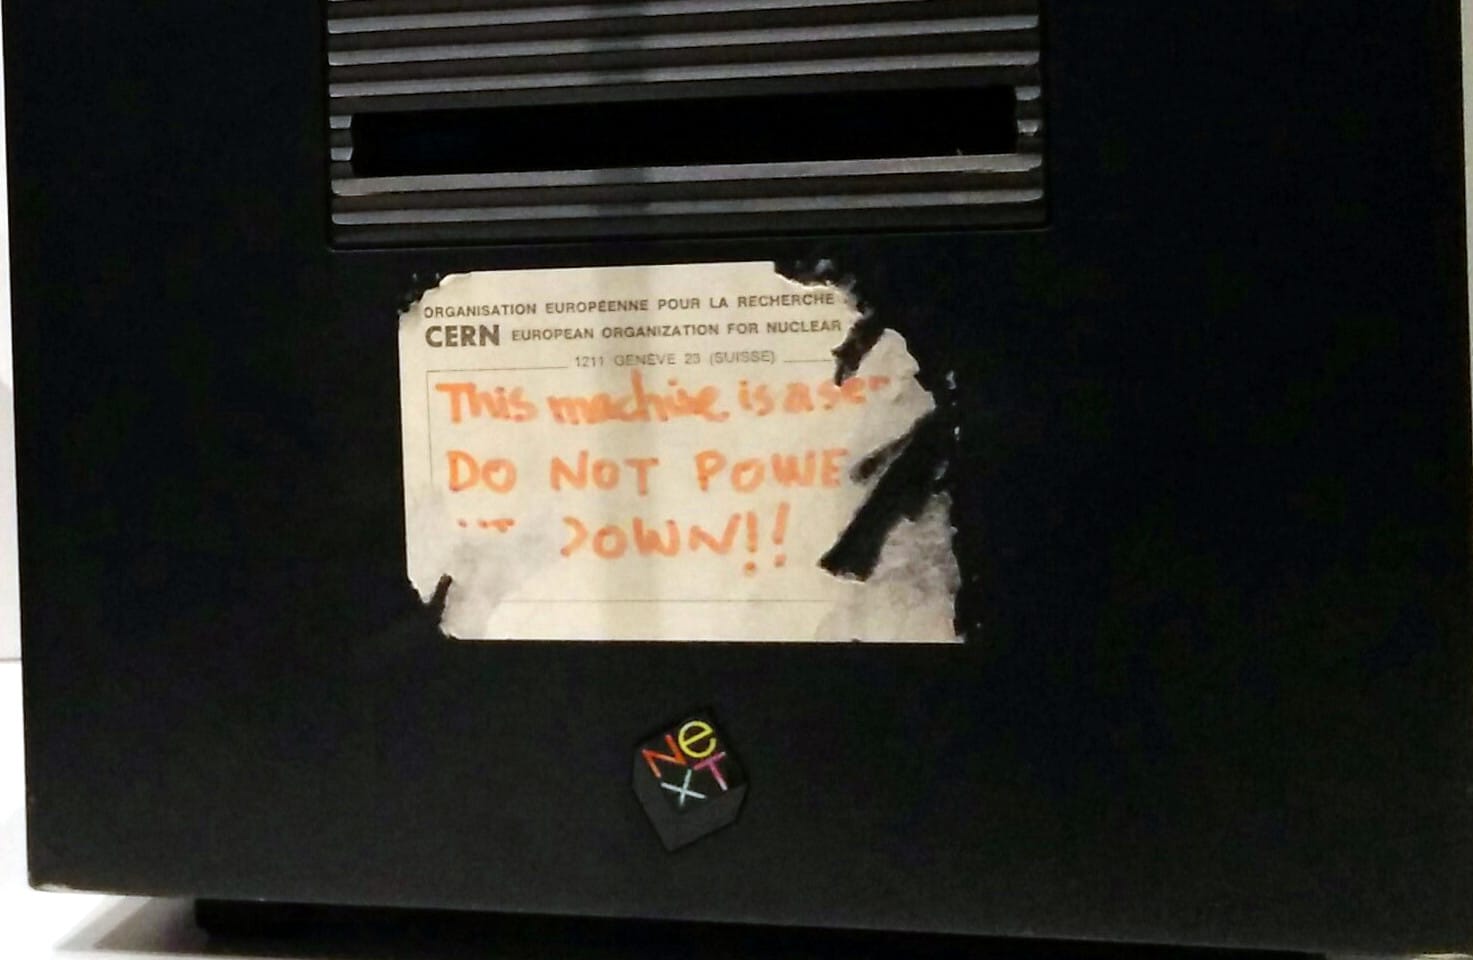
While NeXT hardware was well regarded, it never really caught on. In the long run, the better result of NeXT engineering was NeXTSTEP and how neatly it wrapped UNIX in a clean, user-friendly, graphical interface. It's quite an accomplishment.
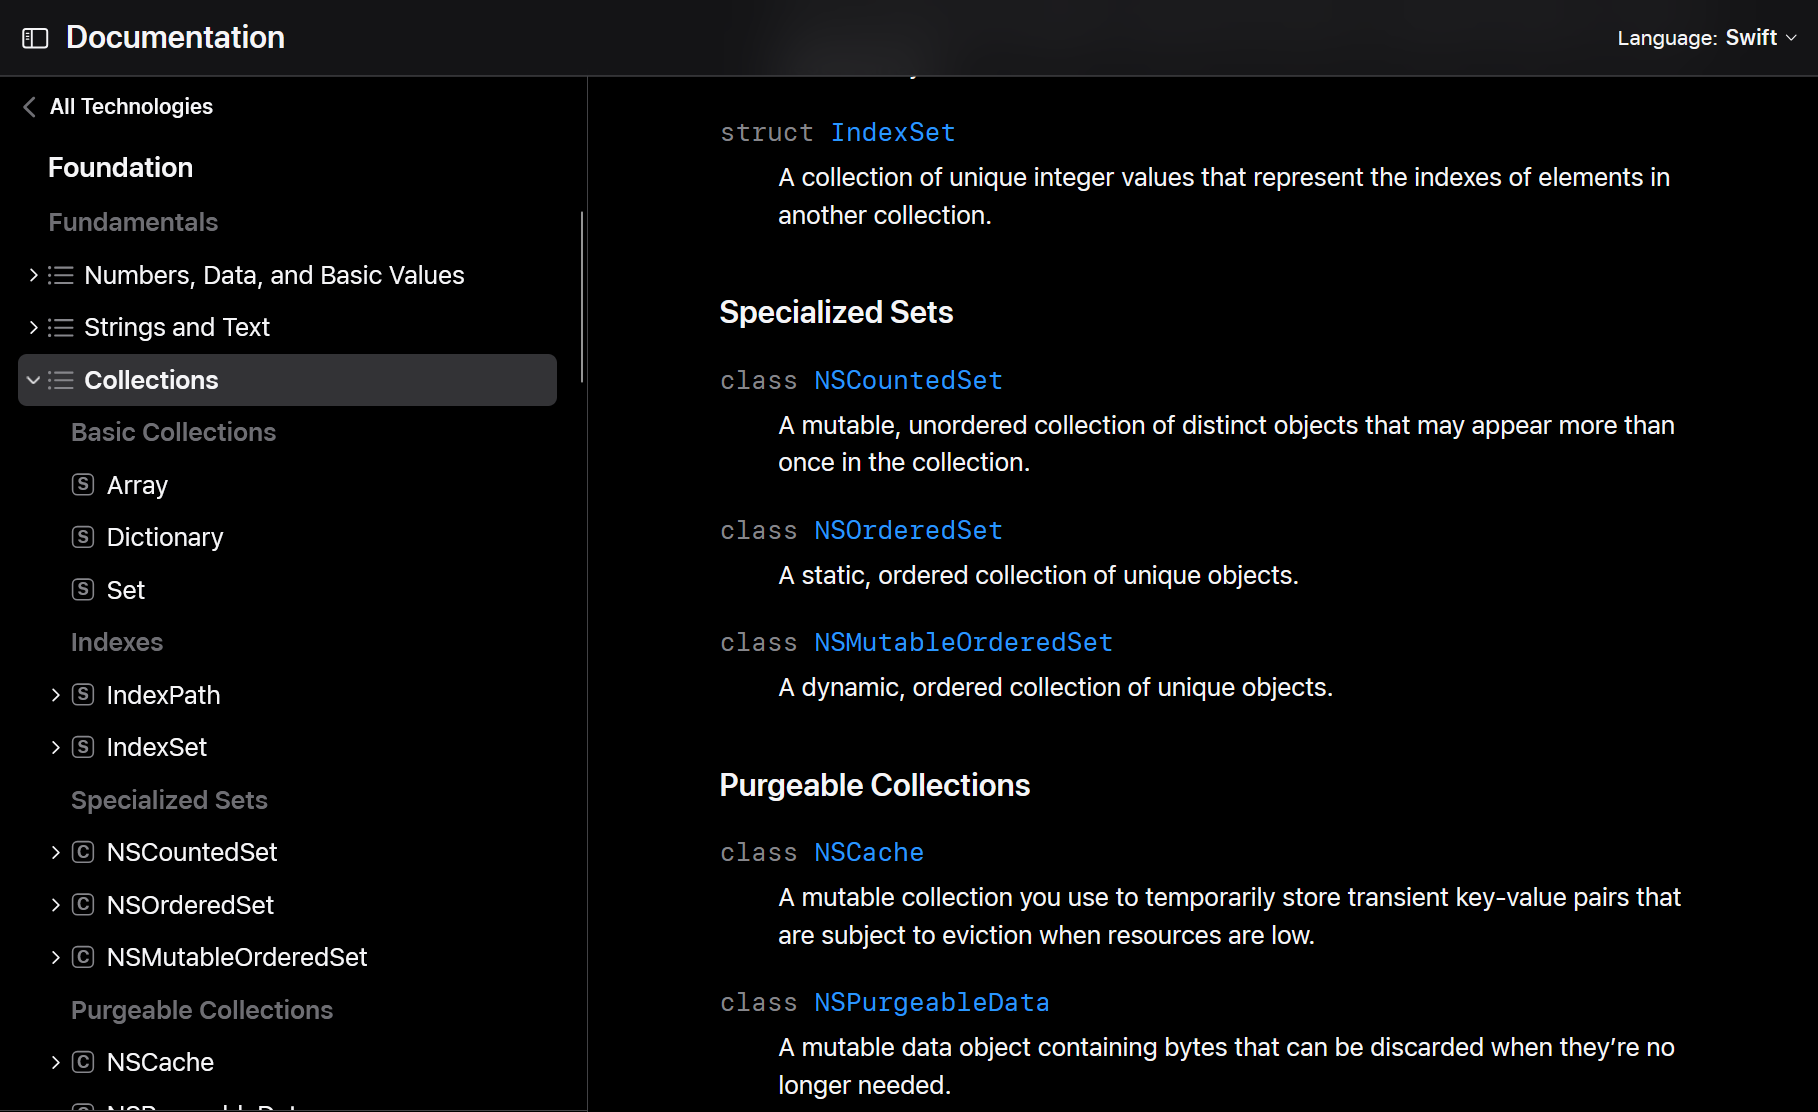
For me, it was the technology behind NeXTSTEP/OPENSTEP developer tools, Objective-C and Interface Builder, that kickstarted my programming career when those became the OS X development environment (hat tip to Aaron Hillegass's Cocoa Bootcamp at the Big Nerd Ranch). Even today, years after the advent of iOS and Swift, NeXT technology remains in the Foundation layer of Apple software, as denoted by NS-prefixed classes (a name-spacing trick from the Objective-C days).
For this investigation, I'm using NeXTSTEP 3.3, the last version before transitioning to OPENSTEP. NeXTSTEP looks and feels like a modern system, with some choice differences. Familiarity with any modern operating system, especially macOS, will inoculate you from breaking out into hives using it.
Considering the eye-candy Jobs seemed excited to add to OS X after the Apple merger, NeXTSTEP is positively staid; nothing here screams "lickable." If you've ever wondered what Susan Kare could have achieved if she'd had a larger canvas and palette (NeXTSTEP is 2-bit) than the original Mac, look no further. I like it.
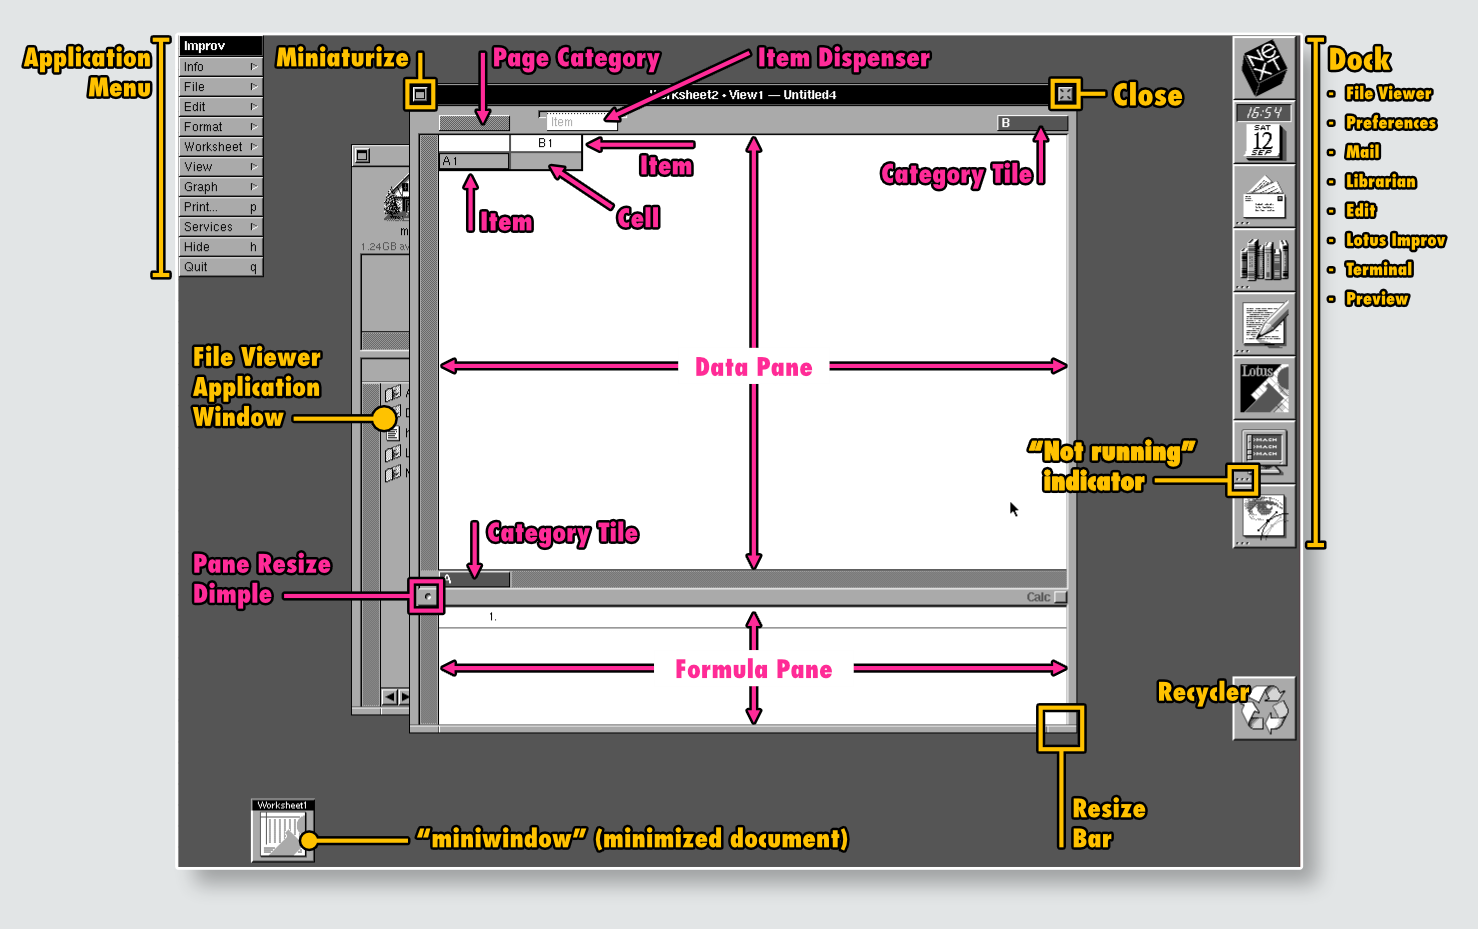
The dock is present, though more rigid than the playful fluidity it acquired when transitioning to OS X. No "genie effects" nor dynamic magnification; it is ever-present and doesn't hide itself when not in use. Some applications change the dock icon when running (like Mail), while other applications do not (like Edit). One odd quirk is how the dock indicates running apps, by the absence of three dots on an icon tile. That's a strange choice, decorating the inactive icons.
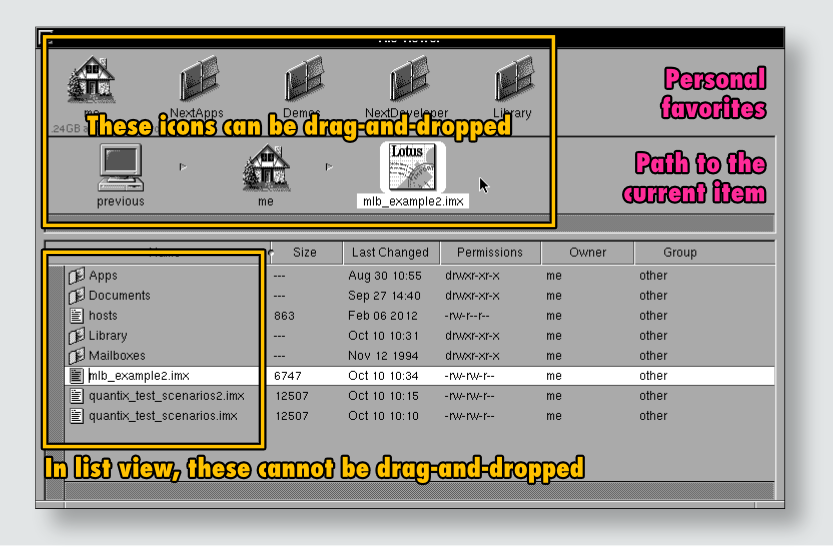
File browsing adds a little complexity to system usage. The file browser contains its own mini-dock for favorites, the path to the currently selected item rendered as giant icons, and the file browser proper. Dragging files and folders around can only be done with an item's full-size icon. If you're browsing in list view, you can't drag list items into a folder or the dock, for example. Bit of a head-scratcher, that one.
Menuing for all applications is handled via a user-positionable, vertical menu. Sticking the menu somewhere sets its position for the active application, and every application can have its own position. You could theoretically have the menu jumping around all over the place as you hop between apps. Thankfully, it can also be called up at the current mouse position with a right-click; shades of RISC OS.
Also, good news for those who love the spinning beach ball on macOS! You'll feel that little ASMR tingle when it appears, especially if you run a color workstation. It's funny the things that can make something feel like "home."
Honestly, my biggest issue in adjusting to NeXTSTEP is the mouse. By default, it feels weird to use, with a dual-level acceleration curve, one for slow movement, one for fast. Crossing the threshold between "slow" and "fast" jumps the cursor across the screen when the alternate acceleration curve kicks in. I could never find my cursor except when moving the mouse verrrryyyy slooowwllllyyyy. Luckily, the emulator Previous has tools to help compensate (check "Sharpening the Stone").
Overall, you'll only need to adjust your thinking a little here and there, forget some modern habits, and you should be comfortable with NeXTSTEP in short order. 35 years later, it still looks and feels much like any modern operating system.
Almost depressingly so? Maybe that's a topic for another day.
Formula 1
Question: what is interesting about the following screenshot from Improv?
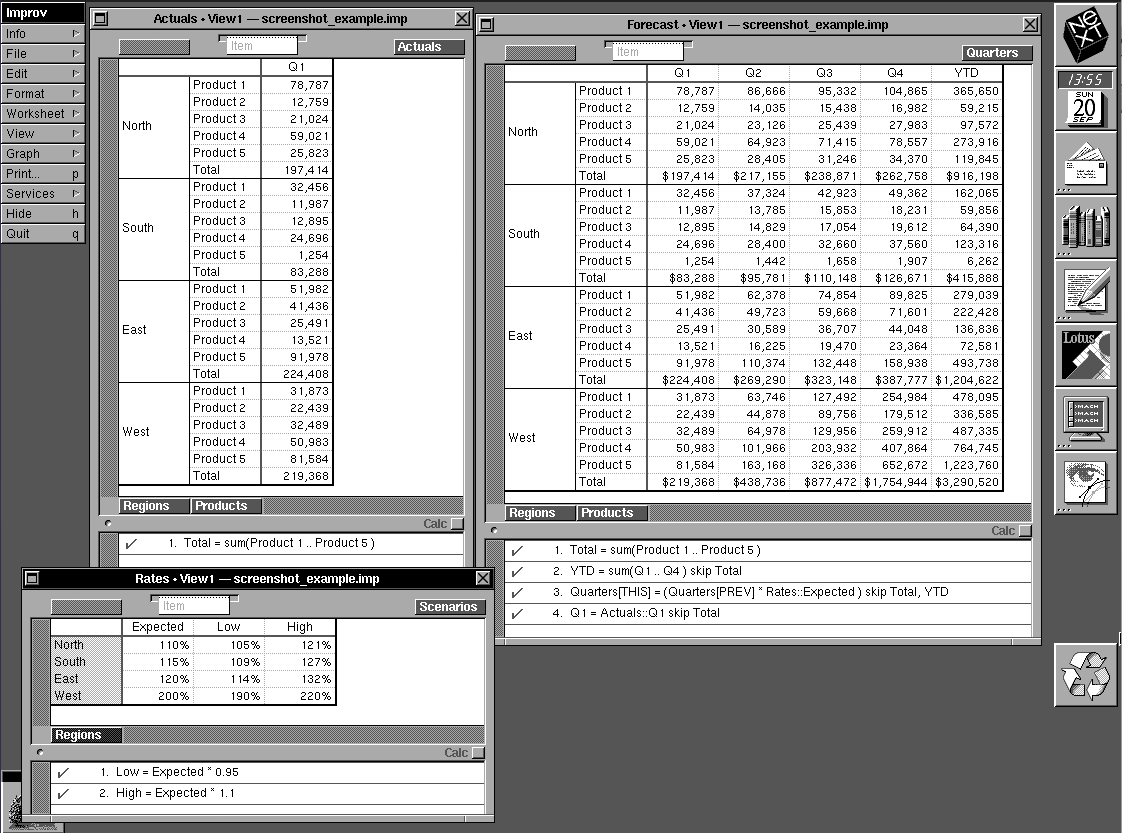
Answer: it contains all information necessary to build a copy for yourself. All data, formulas, dimensions, and relationships are exposed and visible. I note this not to suggest that screenshots are a great way to share Improv worksheets with others, though you could; the sheet above was rebuilt from a screenshot, in fact. Rather, I want to illustrate how "graspable" data can be in Improv's environment. Its formulas read naturally, and value references match the item names in the table. The work does what it claims.
Let's interrogate that a little more thoroughly.
To understand Improv is to forget what we know about spreadsheets. Slash commands? Never heard of him. B1? J93? K12 = int(A14 * lookup(B2..B7))? The ramblings of a madman. Rather than generic alphanumeric column/row identifiers, we define our rows and columns with "categories of items" specific to our domain.
Put another way, instead of asserting, "Columns A to L represent the months, and rows 1 through 31 represent the days," we will create a category called "months" and define twelve items for it named "January," "February," etc. and we will create a category called "days" and define 31 of those.
Take a look at these comparative videos which illustrate the difference. First, I'll use LibreOffice Calc to create a months/days grid, apply a value to January 1, and calculate December 31 as a multiple of January 1.
Here's how that same table is created in Improv. There are three things to note: how sequential items are generated, how categories are named (not strictly necessary for this simple example), and how formulas are created/applied.
There's a lot to absorb, I know, starting with how a new, blank worksheet consists of a single cell, not an infinite table of empty cells. Improv works with only and precisely the data we define. Where in the LibreOffice example we attached meaning to the columns by adding labels to the top of each column, that was for our benefit not Calc's.
I could, just to feel the warm, snuggly blanket of classic column/row naming, make an Improv category called "columns" and name my items A, B, C, etc. and a category called rows, with names 1, 2, 3, etc. Were we to take such a pedestrian approach to categories and items, we would diminish the magic of Improv's formula builder.
The bottom panel holds all formulas, which are applied at the granularity defined, in the order shown. In the example, I specified December:1 = but could just as easily have targeted all of December by specifying December = . That single formula would apply to every list item in December without needing to copy formulas through to each cell, nor set absolute/relative markers for cell references.
Here's a simple expansion of the previous table. Every day in January increases by 10%, and its corresponding day in December doubles the January value.
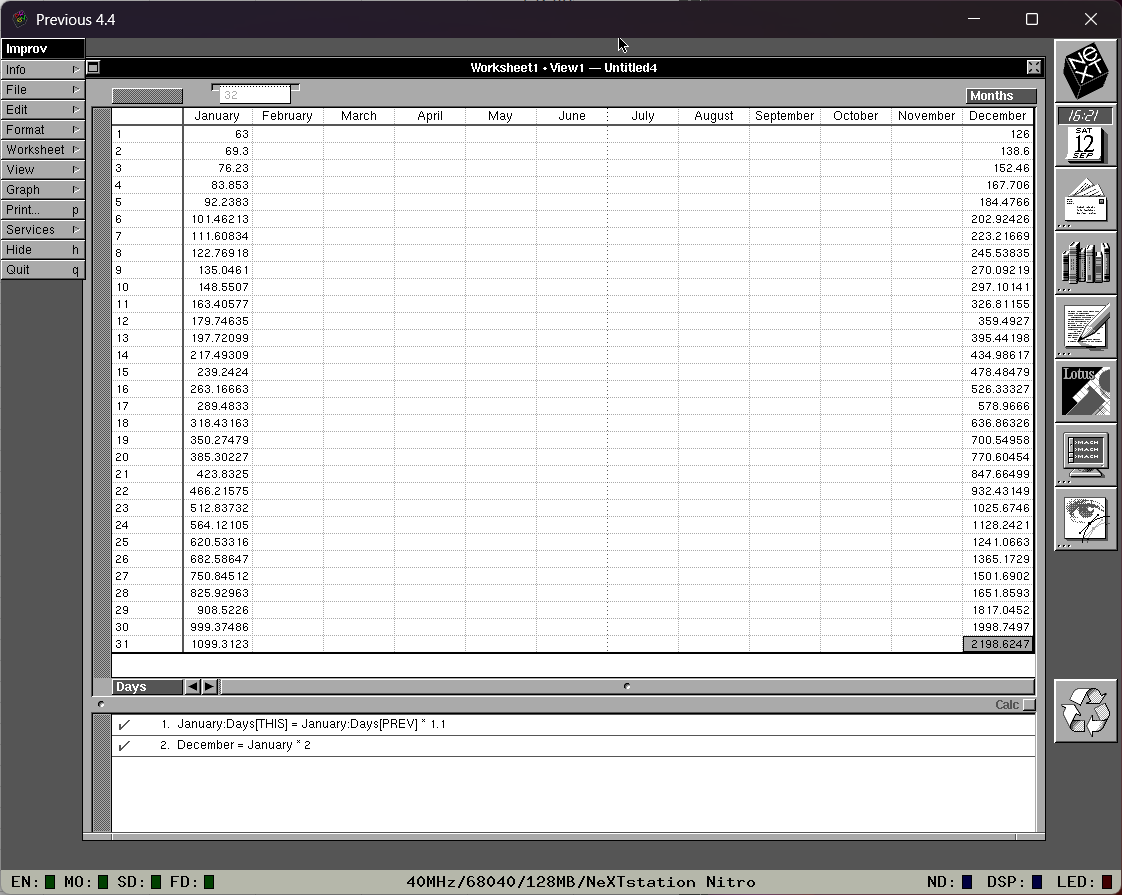
Days in the current layout) via THIS then jumps backward one cell via PREV Spelled out more explicitly we're saying, "THIS day in January = The PREVIOUS day in January * 1.1" After that, more generically, we define every December value equal to double its corresponding January ("for the current row" is implied) value.The two formulas shown are the only two formulas for the entire worksheet. I want to stress this; there are no other formulas lurking inside cells, hidden from view, waiting to be revealed by a selection or editing process. There are no duplicated formulas per cell, each increasing a relative cell reference by * 1.1 . We simply refer to categories (in this case "months" or "days"), items (as "January" or "27"), or specific intersections (as "April:19"), including relativity signifiers [THIS] , [PREV] , and [NEXT].
You might be thinking of ways to trick the system; to confuse and befuddle it. Why would you want to bully an old app like that? What did Improv do to deserve such shabby treatment? "What if two items have the same name? What if two formulas target the same cell?" Fret not, all shall be revealed and you will feel proper shame at trying to confuse this old program.
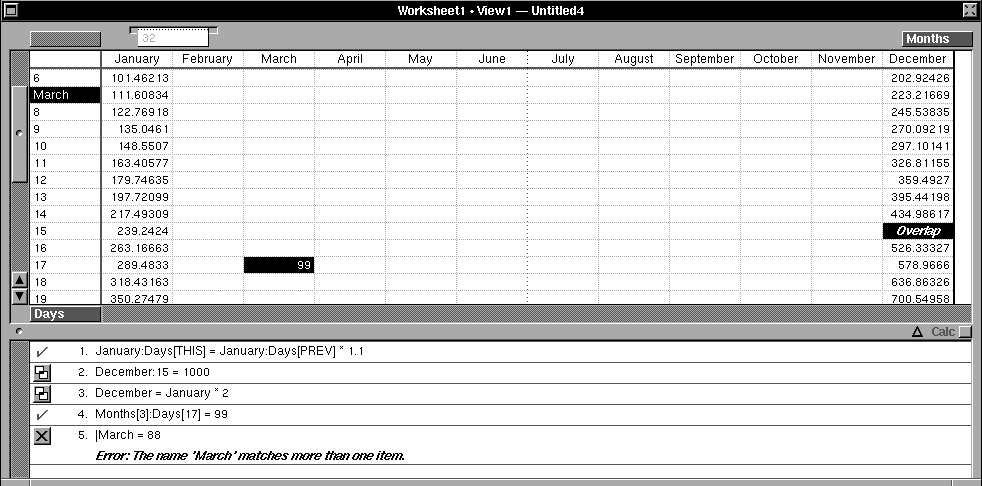
In the above example I have renamed one of the Days as "March," to create ambiguity when referencing "March." Does "March" mean the Day or the Month now? We can be explicit, referring to Months:March. Note though that if we aren't explicit, Improv will be on to our tricks and call us out, as in formula 5.
In formula 2, I set December:15 to the static value 1000. In formula 3, I also set it to be calculated as "double its corresponding January value." Note the "overlap" icon (two intersecting squares) on those formulas and the Overlap text in the cell. Clicking the overlap icon gives us an opportunity to resolve ambiguity by explicitly selecting which formula should win for that cell.
Cleanly handling formula ambiguity was originally seen by the prototype team as an intractable engineering problem. From "Improv: The Inside Story", by Simson L. Garfinkel, NeXTWORLD, Fall 1991:
The Back Bay (Improv's development codename) group thought that the possibility for formula conflicts was a real weakness with the program. There seemed to be no way to automatically resolve conflicts.
"Jobs said that 'this is not a weakness, it is a great feature!'" remembers Paul (Kleppner). "With 1-2-3, you can copy and blow away a formula.'' The fact that Improv could automatically detect conflicts and tell the user about them was a major step forward.
Personally, I like Improv's solution. I honestly think more software should be very dumb, and not try to intuit or guess what I want. Tell me the problem in clear language, and provide the simplest tool that gives me the most control over problem resolution. Be smart about helping me, don't try to help me by being smart.
Help yourself
Before we get in too deep, I want to make sure I note Improv's beautiful help system, replete with index and search. Considering the difficulty in tracking down a manual for the NeXT release, having this available during my exploration proved invaluable. It's neatly illustrated, with terse (sometimes overly terse) descriptions of the tools, hyperlinked to other pages of the documentation, as warranted. Improv felt it could do even better than that and made its help contextual.
The Help system, when invoked, defaults to displaying documentation for whatever is currently selected in the user interface. That's very useful, but becomes supercharged with "Point for Help," as demonstrated in the video above. This turns the cursor into a ? symbol, and whatever we click will be revealed in the Help window.
This is a great idea, because I don't always know what Lotus wants to call some little interface doohickey, so I don't know what to search for. Now I know: the "Calc" button is a "Status Indicator" and the triangle icon that sometimes shows up is the "Formula Error Indicator." Pork chop sandwiches.
Incorrect overhand fashion
Looking through Usenet archives, I saw this called "toilet paper" by at least one person. Lotus called it the "item dispenser." It's an interesting first attempt to do something we take for granted today and only exists in the NeXT version of Improv. It's cute, but smacks of someone being overly excited with new development toys.

If we need to generate a list of items to populate an axis of your data, this tool generates sequential list items for you. It does its best to kind of "guess" our intentions, so if we type in "Sunday," then pull down on the dispenser, days of the week will be auto-generated in a list. We then "tear off" the list, which loads the cursor with the items, which we attach to an existing item, appending that category with the loaded list items.
That means we need to have at least one item in a category onto which the list can be attached. This is annoying, because the existing item likely has no relationship to the generated list. I'm always having to make a list, attach it to an existing item, then delete the original, unrelated item. These days, we can type directly into a cell and extend that cell intelligently across adjacent cells. In fact, Lotus would switch to that methodology when migrating Improv over to Windows for version 2. Hold ALT and drag an existing item to get the same effect.
The original dispenser truly is a feature that could only have been thought up within the NeXT environment. I don't hold it against the devs for getting excited by the GUI flexibility Interface Builder afforded. I, too, did the same back in the early OS X 10.2 days. It practically begged us to play around with GUI ideas, remixing elements into new configurations. "First Responder" and "bindings" stans, represent!
One of the great features of that development environment was how easy it was to “say ‘No’ a thousand times” while trying ideas. Lotus embraced that, achieving quickly on NeXT what had blocked their progress on OS/2 and Microsoft's Presentation Manager.
The best part about developing a user interface with Interface Builder, many of Improv developers agree, wasn't the ability to design a single interface quickly: it was the ability to try out a lot of them. "It let us develop a lot of bad UIs,'' says Pito. "We could have an idea and in an hour we would have it on the screen.''
The "item dispenser" was singled out as a specific tool that benefitted from Interface Builder; there really wasn't anything similar to its rapid, iterative, GUI development at the time. In fact, I might go so far as to say there's nothing quite like it today, even from Apple.

Dimensional rift
Joel Spolsky, in editing The Best Software Writing I, added a personal aside on Lotus Improv, blaming its failure thusly, "Improv required you to define strict n-dimensional hypercubes for your data. There was none of the flexibility of traditional spreadsheets."
I suppose if one wanted to paint Improv in the most inhospitable light, Spolsky is correct. In practice, it doesn't feel as impenetrable as his description. However, I do think he's on to something that gets at the heart of why Improv never gained traction.
For now, let's hold our collective nose and dive into the scary, foreboding waters of "n-dimensional hypercubes" and model up some baseball. Our first dimension will be Year.
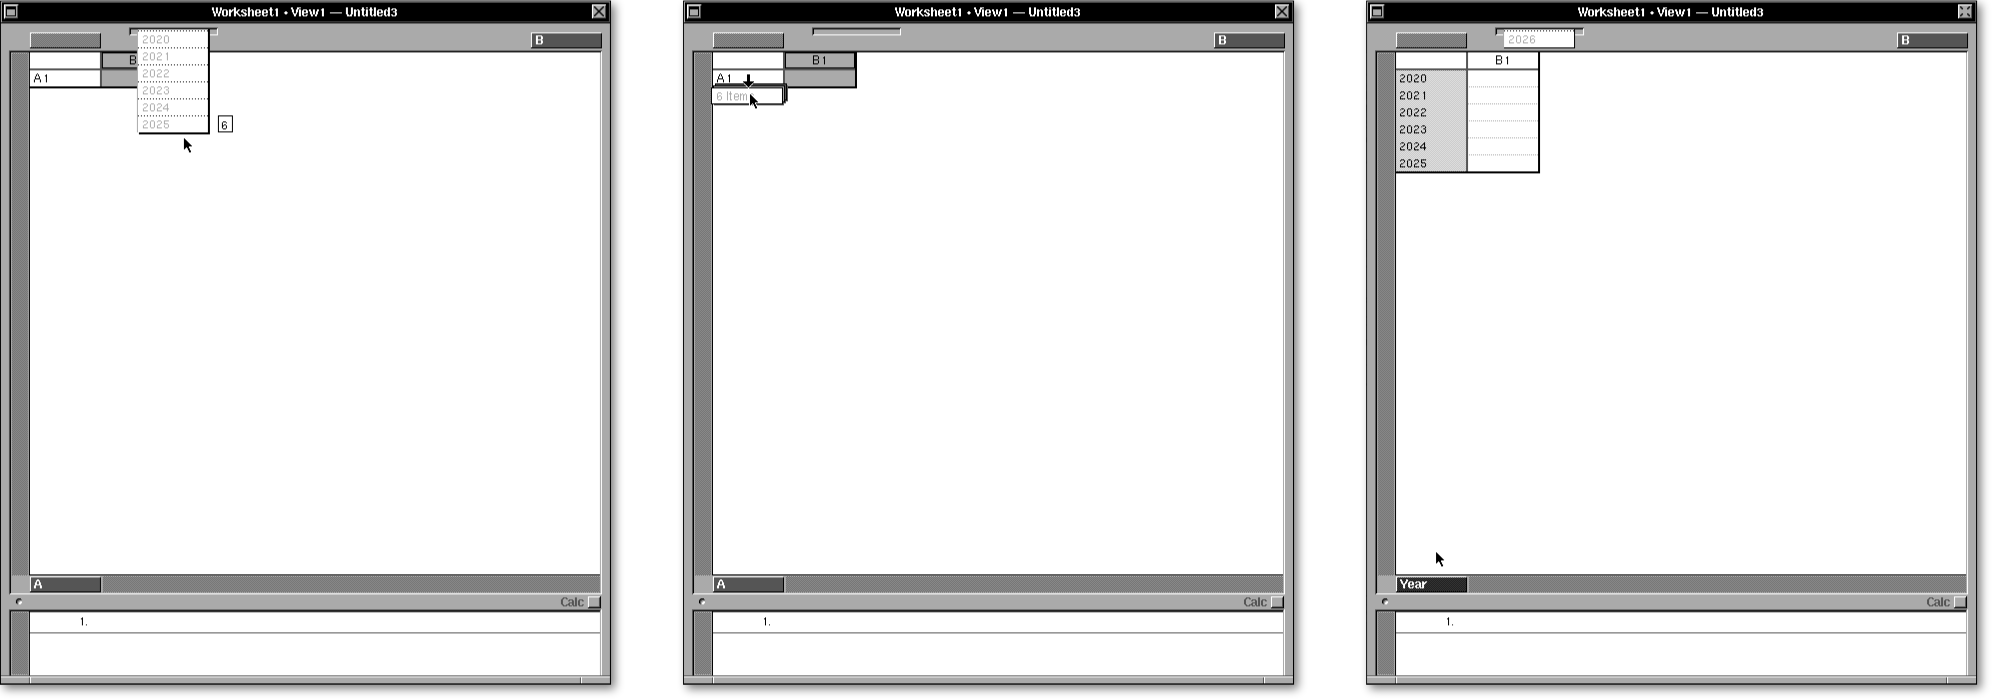
Let's add a League dimension next.
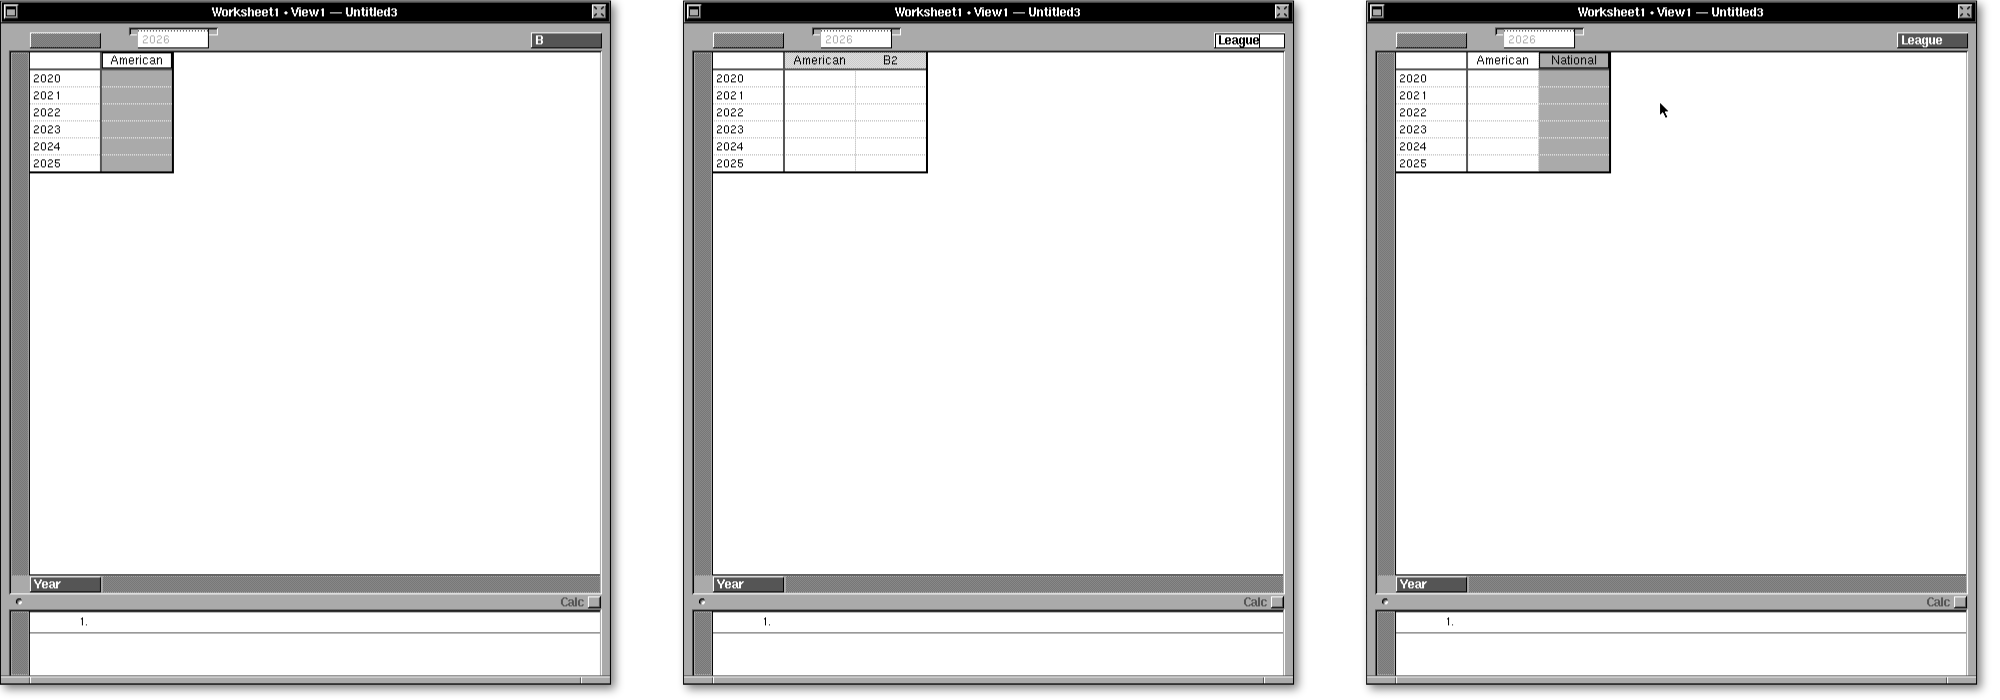
Enter will add a new, empty item to a category; here B2Next, we'll get more granular and add Division. Internally, Improv separates our work into three parts: data, views, and formulas. What we see on screen is just Improv's best-effort to represent our three-dimensional data flattened out into a two-dimensional view. Improv adds extra columns to the view, as necessary, to ensure we always see the full extent of our data relationships.
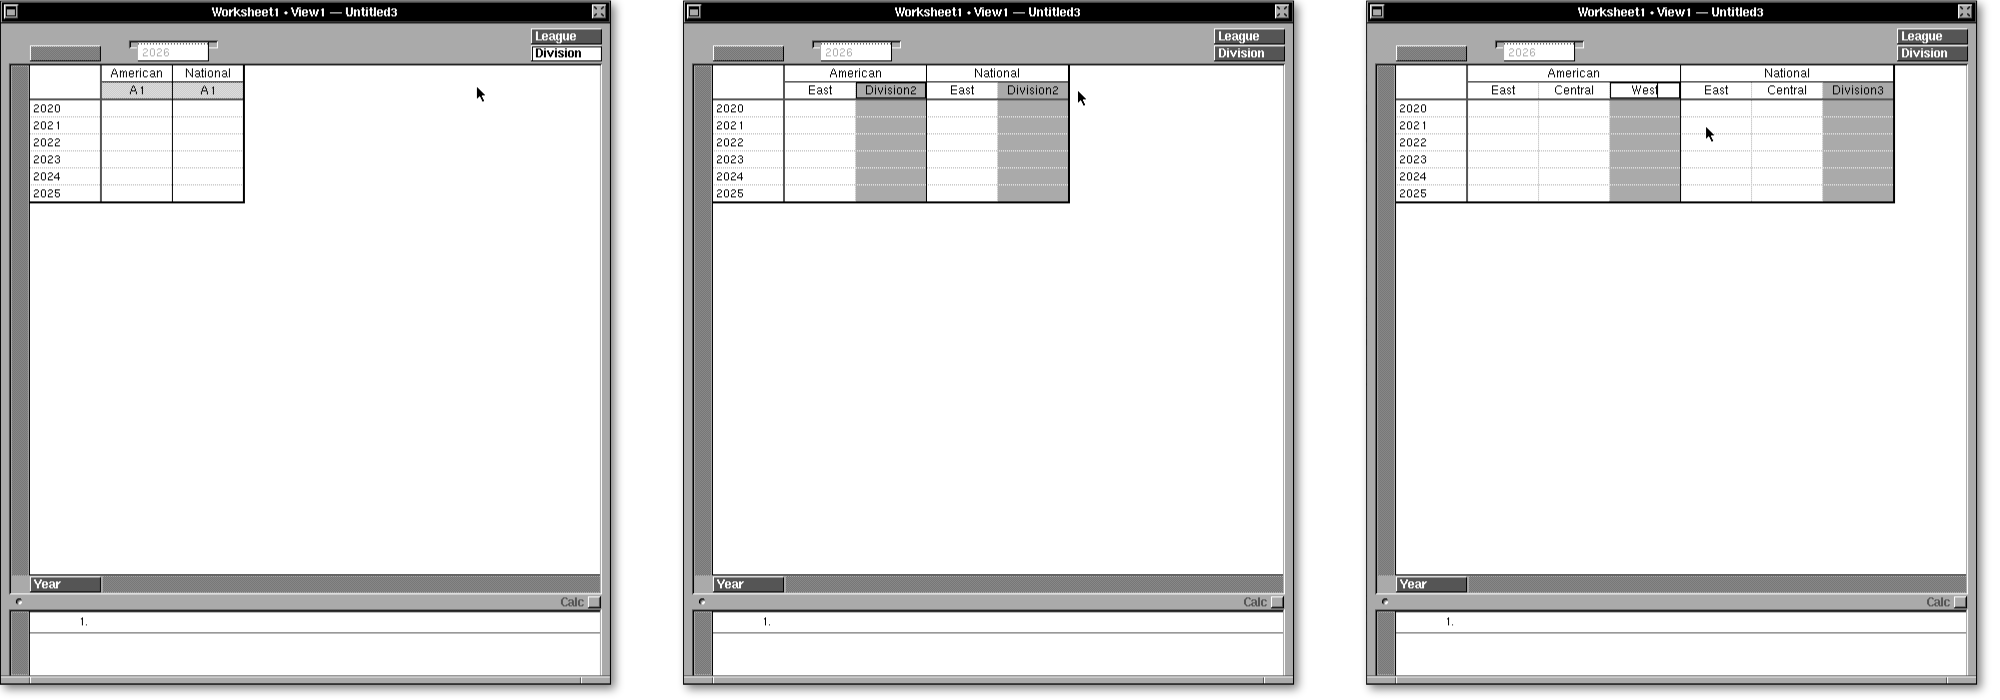
West under American and when I hit Enter the corresponding National "Division3" column will update automatically to match. These will always be synchronized, a fact that will not bite me later, I'm sure.Now, we'll add some win/loss data and the next thing you know we’ve built a 4-dimensional hypercube. Are we scared yet?
Since I've only modeled at the "Division" level, I'll add together divisional wins inline to calculate the totals and... hmmm... "No dice," as they say in baseball (Presumably. Are dice involved in baseball?)
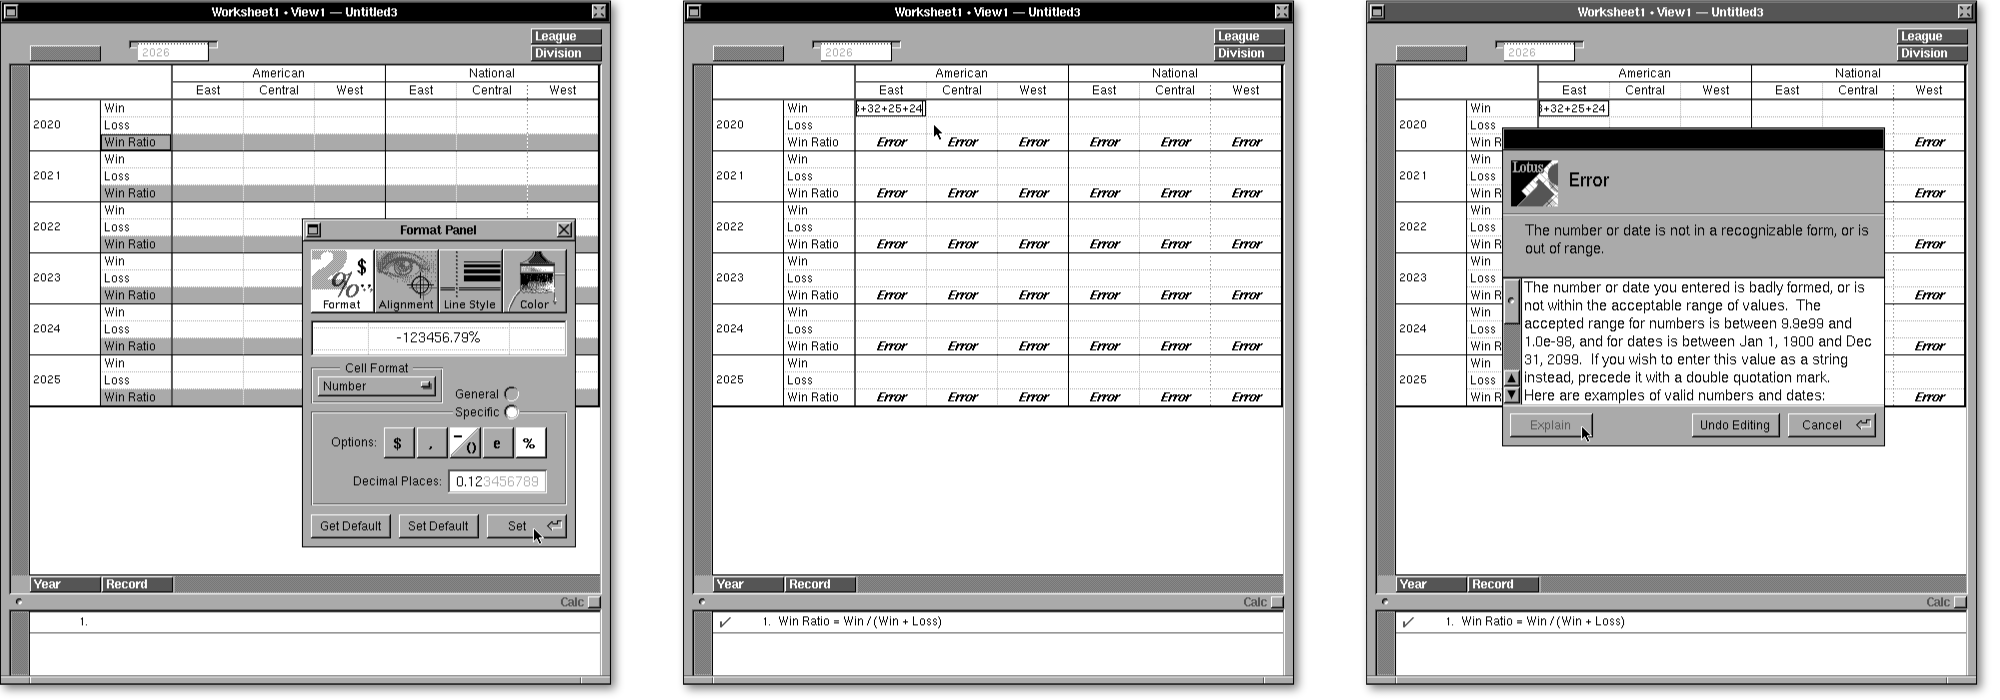
Record dimension with Win, Loss, and Win Ratio as items. The Format Panel lets me set the ratio to a percentage. Adding a formula for Win Ratio results in Error in all Win Ratio cells, because there is no data to calculate. I tried to remedy that with a quick equation in one cell and, hey, at least there's an Explain button showing what went wrong.Alas and alack, we can only enter concrete numbers, dates, or text into cells; any formula, no matter how trivial, must go into the Formula Panel (bottom). In this case, I could add a formula that targets a specific cell, as American:East:2020:Win = 40 + 33 + 32 + 25 + 24, but the whole point of a spreadsheet is to automate that kind of junk for me. I suppose the path of least resistance is to add a Teams category to add up all team wins and, wait a second...
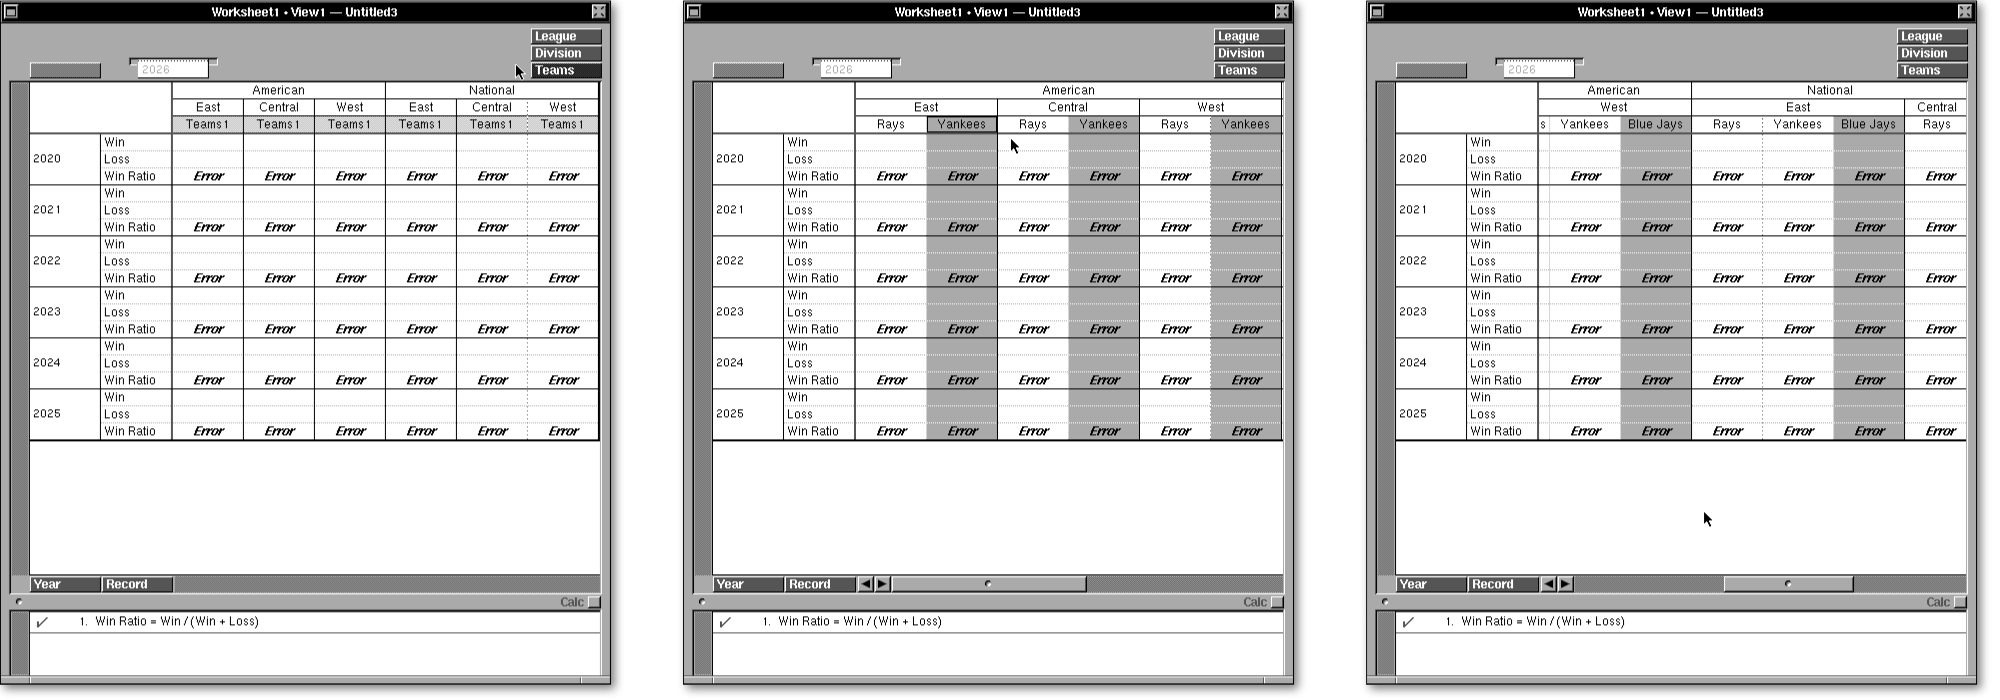
Dang it, that petard I confidently told myself wouldn't hoist me has come around to do precisely that. Here we see the downside of dimensional modeling, at least for the layperson, and arguably for most typical spreadsheet users. It all looks like a neat little chart, but that word "dimension" describes and reveals the problem. To add a category, its items necessarily apply to all other categories. Teams don't do that; they are unique to each League and Division.
But we just might have a way out.
Group think
Lotus engineers clearly understood that categories alone weren't going to cut it. Categories impose rigidity to our data that does not always accommodate the messiness of real data. We need another way to organize our data.
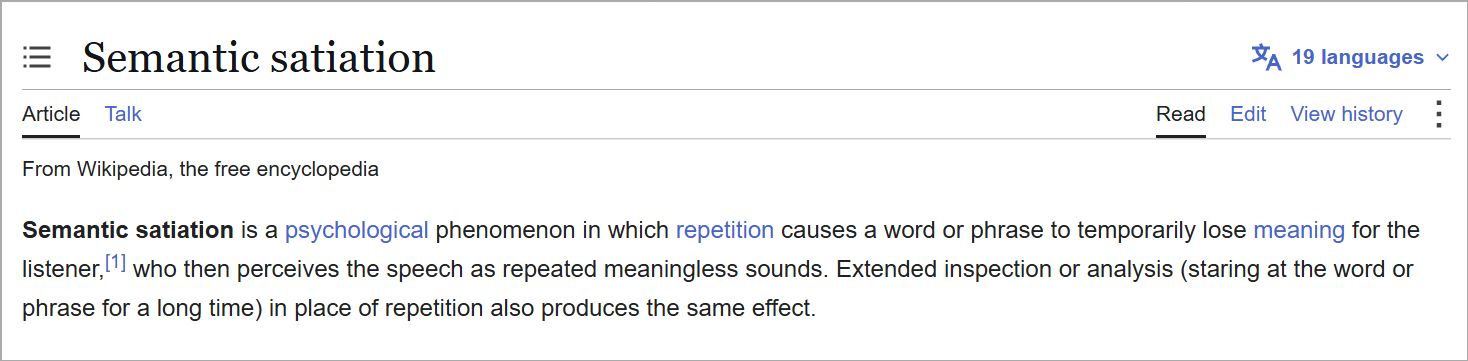
Groups are intra-category, named collections of sequential items. Make a category and add a bunch of individual items. Select a sequential group of some subset of items and group them, giving that group a unique name. Once everything is grouped, groups of groups can be grouped to group a group of ... wait, I got myself confused. Groups can be grouped, 'nuff said.
With "Teams," we quickly run into a side-effect of groups, and how it can necessitate a cascade effect across multiple categories. I want to add teams and group them by "Division," but that forces me to also make "League" a group as well. What was three categories have now collapsed into one: "Teams"
Here's what that looks like in practice.
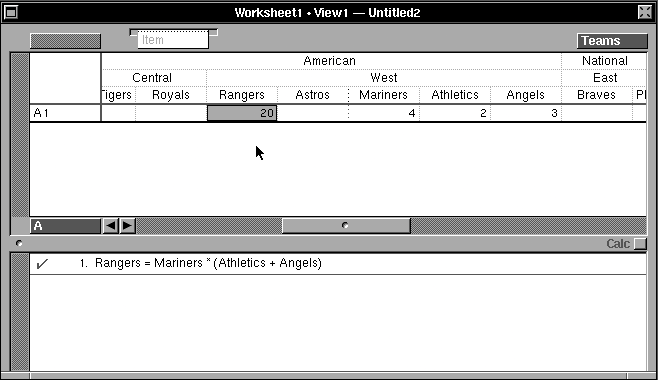
We still gain the benefit of name references in formulas, as in the above untethered-to-reality example. A reference to East would apply to both American and National, unless we specify by . as in National.East and American.East
Groups can be subtotaled, using the groupsum() function, as you can see in this more data-rich chart of the MLB stats from 2022 to 2026. Notice, however, we risk a conflict for Percent in our Total field, where there are two formulas battling it out for dominance over the same cell calculation. The handy SKIP keyword will skip (i.e. "won't apply this formula to") groups, cells, items, and categories as designated.
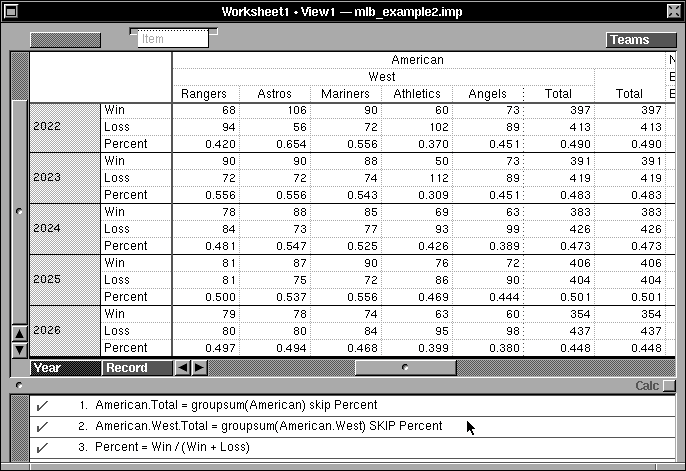
Groups helped bring granularity and specificity to our data structure, but the more categories we remove, the more we remove access to the very feature that has kept Improv in the back of nerd minds for decades. You know what I'm talking about.
Can't spell "pivot" without "Pito"
FINALLY we get to the point those in the know have been anxious to talk about, "Lotus Improv invented pivot tables. It says so right there in Wikipedia."
At this stage of my knowledge of all things retro productivity, I think the most I'm willing to concede right now is that Lotus Improv likely invented pivot tables as we understand them today. But, like Yoda coyly teasing the existence of Luke's sister to a guy who should have already known about her, there is another program, a future Stone Tools subject, that may lay claim to the title of "first pivot table." I exercise my right, as "guy who runs the blog," to reserve final judgement on this point until then.
For our purposes today, it's a true enough statement and the inventor even has a nice video on YouTube in which he shows it off to Lotus staff for the first time. Meet Pito Salas, inventor of the pivot table.
Mike Wells (shown in the thumbnail) takes a question at 28:40 and reveals that NeXT has "Objective Fortran" and "Objective Lisp" ?!?!
Salas, now retired, developed the idea while working for Lotus Development's Advanced Technology Group. He put together a fakey version of his vision, a kind of slideshow, showing off the things he wanted to be able to do: English-like formulas, multi-dimensional data, and rearrangeable views into the data. He was given the greenlight to proceed, "All those [ideas] I had described with hand waving,'' recalls Pito. "I had no clue how to build it." A year of nose-to-the-grindstone later, and a prototype dubbed "Back Bay" went on US tour, wowing financial modelers. Everyone who saw it, wanted it.
Let's take a look at how Improv handles pivoting. To start, I'm leaving it empty of data, so we can focus on the dynamic view structure more easily. Then, I'll move categories around to show how the view flexes to present the data. Next, I'll put categories into the third axis, called a "Page Category," allowing us to paginate our data. Finally, I'll enter a formula and a little data to show off a trick pivot table contemporaries cannot perform.
Now I'm going to try and replicate this in LibreOffice Calc v26.8. There are a few things to note, but let's first point and laugh at the fumbling attempts of a LibreOffice newbie (me).
A few things jumped out at me while comparing these approaches. First, modeling up a relatively complex data set in Improv is as easy as thinking about it, and the presentation of the data matches my mental model. LibreOffice requires me to bridge a fairly wide conceptual gap between what I want and how I model it, due to the amount of redundant data I have to enter for every line item.
Some items, like "League," translate cleanly, while "Record" does not. In fact, I'm still unclear what the best approach would be to convert my Improv computed item "Win Ratio." LibreOffice has the concept of a "computed field" inside pivot tables, but reaching across columns to pluck out related data to perform computations is complicated.
In Apple Numbers, Microsoft Excel, Google Sheets, and LibreOffice, pivot table data is splintered off into a separate snapshot of the data, dedicated to the pivot table view. Pivot table data can typically be lightly manipulated, but does not affect the original data. The reverse can be done, but only after asking for an explicit update of the pivot table to reflect changes to the primary data table. This is a huge drop-off in ease-of-use from the Improv way of things where every view of the data directly manipulates the base data.
Dragging around categories is just as easy in either approach, though Improv gives immediate drag-and-drop access to what LibreOffice calls a "Filter," i.e. a paged view, and generally "feel better," IMHO. LibreOffice requires us to open up a separate panel and drag things around in there. I will say, however, that being able to filter the filters (i.e. exclude/include specific subsets of data) is handy.
Sheets, Numbers, and Excel (online version) are all strictly panel-based pivoting. Interestingly enough, the panel approach is precisely the interface Lotus rejected, at the behest of Steve Jobs. Once more, from the Garfinkel article.
"But where should the icons for the categories go? After trying a lot of different ideas, the developers decided to create a special icon window.
'And then Steve Jobs came,' says Paul, remembering Jobs's visit in April 1989. Jobs then said, 'You have to be able to touch the categories and move them around. Having them off in a separate window is too removed,' Paul remembers.
'(We) junked the idea of the extra panel,' and put the category tiles on the worksheet itself."
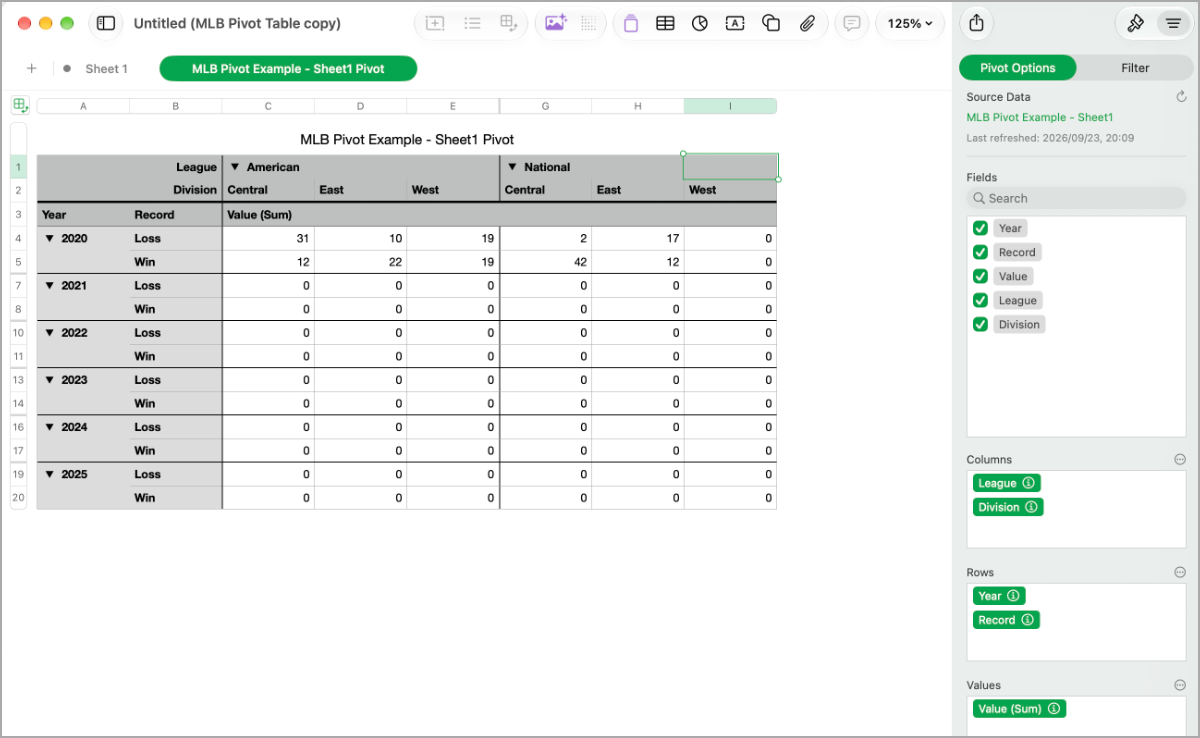
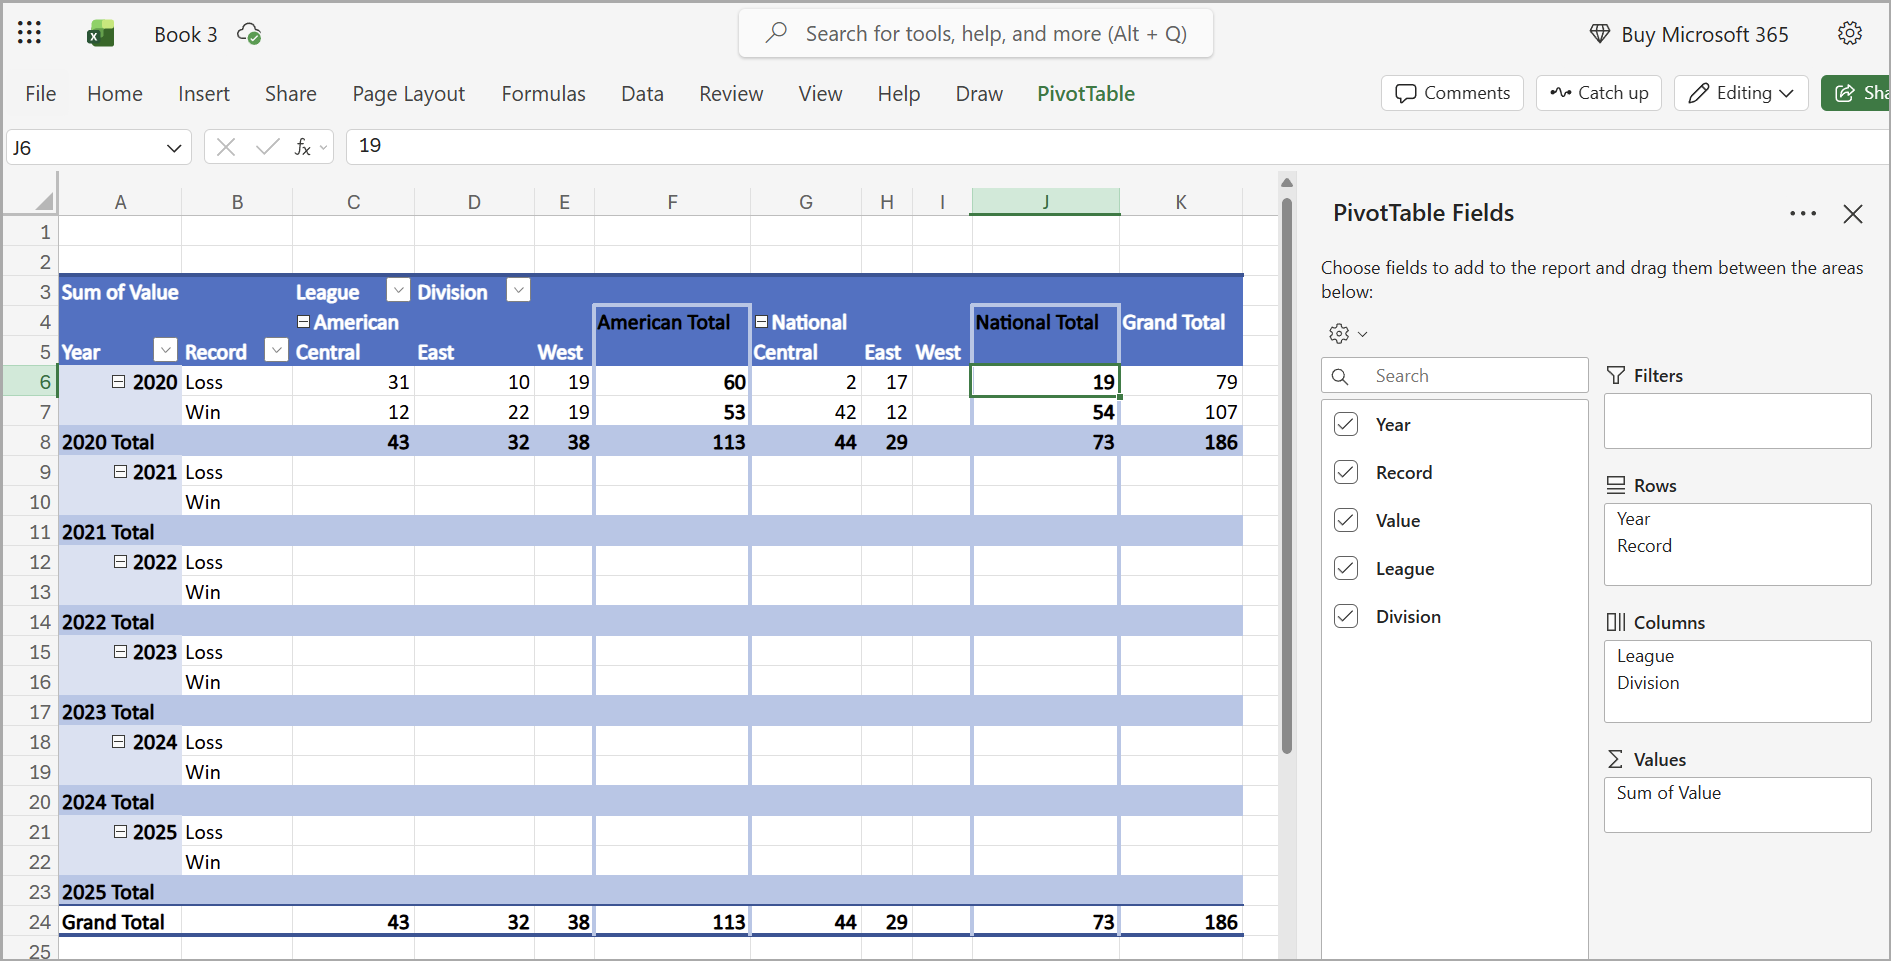
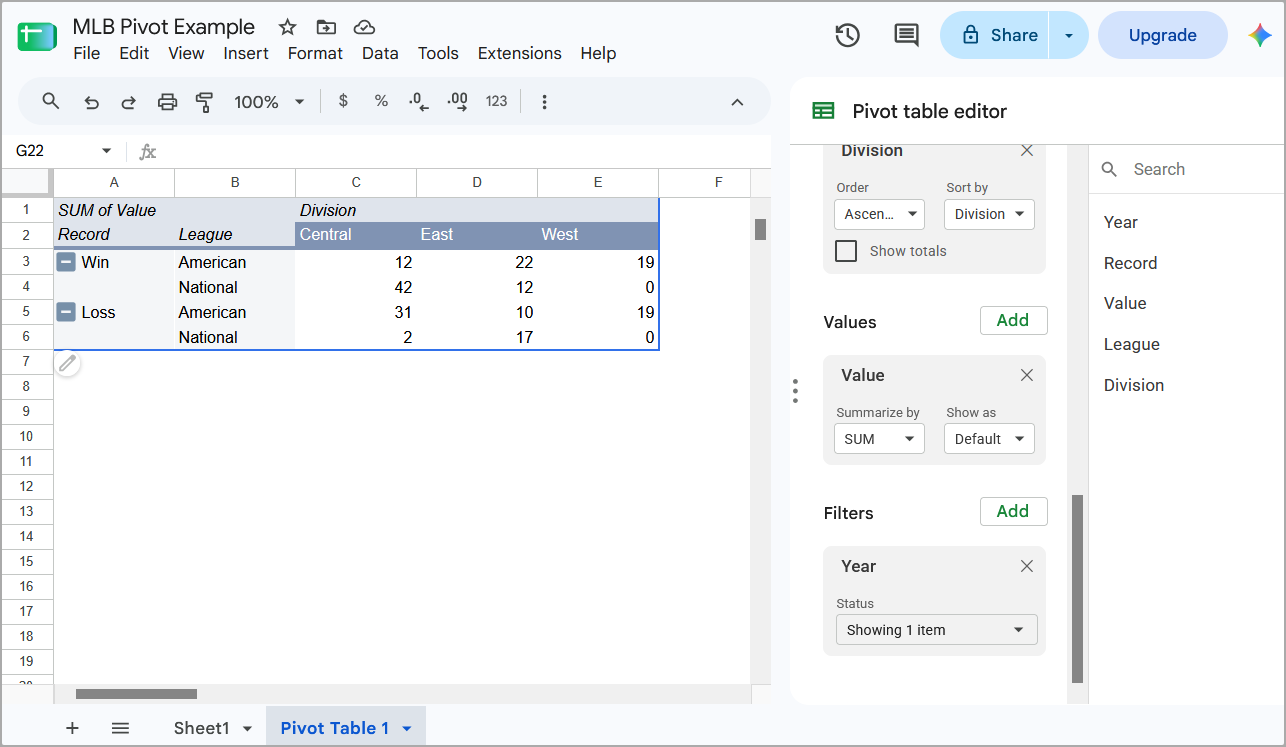
Having now directly compared Improv's approach to dynamic views against modern pivot tables, it is safe to say they are the same only so much as wagyu beef with gruyere cheese prepared by Gordon Ramsay and the sawdust at the bottom of a Happy Meal are both "cheeseburgers." Improv tastes much better.
Dynamic range
A Lotus invention which debuted in Lotus 1-2-3, "named ranges" have attempted to bring order to the chaos of cell identifiers. In 1-2-3, Range > Name > Create will apply a name of choice to a defined cell range, after which that range can be referenced in formulas by that name. So, in 1-2-3 or any modern spreadsheet we can name range F1..F23 as Sales and sum(Sales) will work.
Superficially, this looks similar to how Improv works with categories and items for multi-dimensional data. However, named ranges are for convenience only, and do not establish relationships between data values. In Improv, Sales would represent a fundamental aspect of a piece of data. Getting the sum of all sales is the same, sum(Sales), but it being a dimension on the data gives us deeper options. For a specific year, sum(2020:Sales) will match against two axes at once. sum(2020:Arkansas:Sales) could further pinpoint our summation.
Let's see how this would be done with modern spreadsheets and named ranges. If we want to mimic Improv's dimensional relationships, we must define relationships of interest within each formula, (and those formulas have to be copied over to every related cell) such that:
= SUMIFS(Value, Year, 2020, League, "American", Record, "Win", Division, "East") / SUMIFS(Value, Year, 2020, League, "American", Division, "East")Meaning "sum items in the named range called "Value" only if the Year is 2020, and the League is "American," and the Record is "Win," and the Division is "East")
Of course we could substitute hardcoded filter criteria with values pulled from a lookup, or perhaps extract equated values via a LET statement. Maybe even set up a little sub-table to hold calculated values. Quickly this gets way more complicated than I'd have hoped for, so personally I'd resort to doing it the old-fashioned way and just hardcode in a bunch of cell references. To reiterate, the complete solution for an entire sheet in Improv, where win/loss information is its own dimension, is the single formula:
Win Ratio = Win / (Win + Loss)Chartered plain
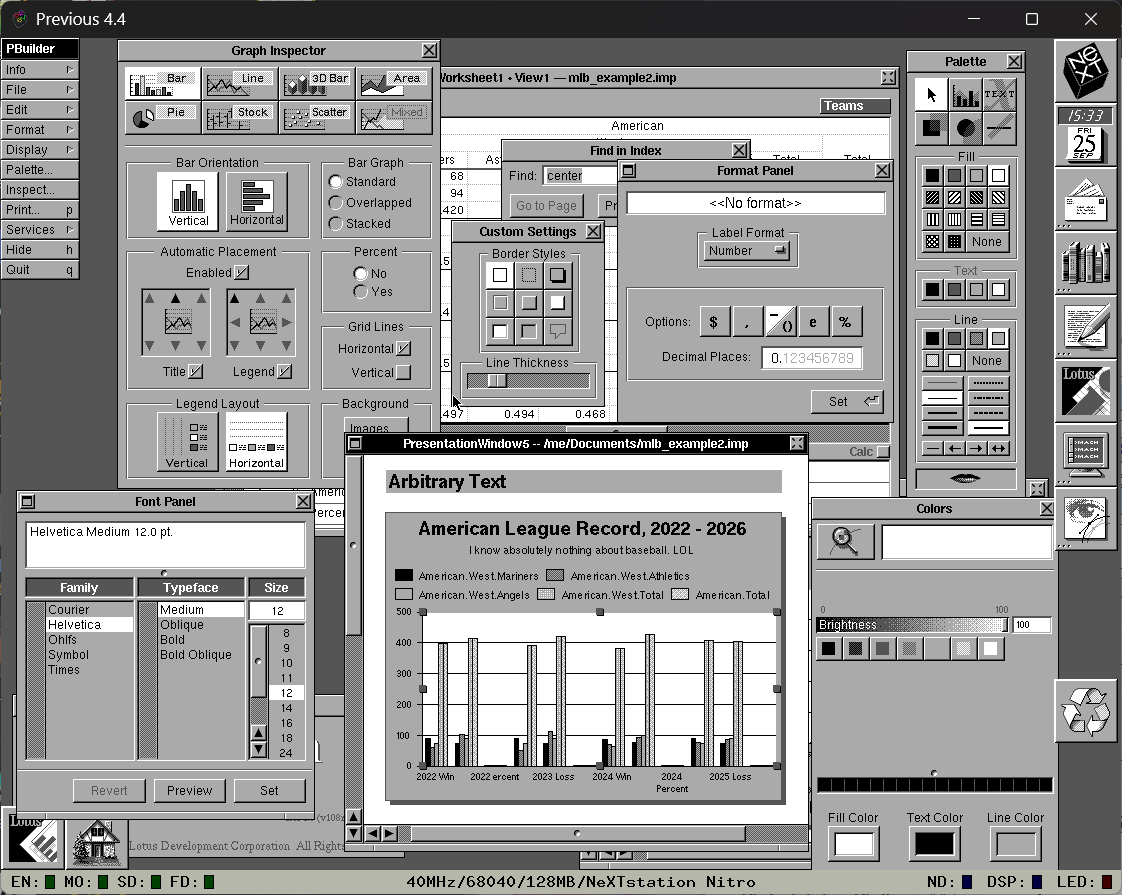
The last of the big features, which takes advantage of NeXT's graphics prowess, is the charting functionality. Creating a chart launches an entirely separate application, Presentation Builder, which has grand plans on becoming PageMaker when it grows up.
Generating a chart generates a full, blank page onto which a chart is placed. A suite of palettes complements the charting workflow, allowing for precision edits of the chart, its titles, colors, positioning, and more within the full page. Multiple charts can be generated and placed on the same page. Arbitrary text and shapes, lines pointing at interesting bits, and even sound annotations (a system-wide NeXT tool, called "Lip Service") can be placed at will.
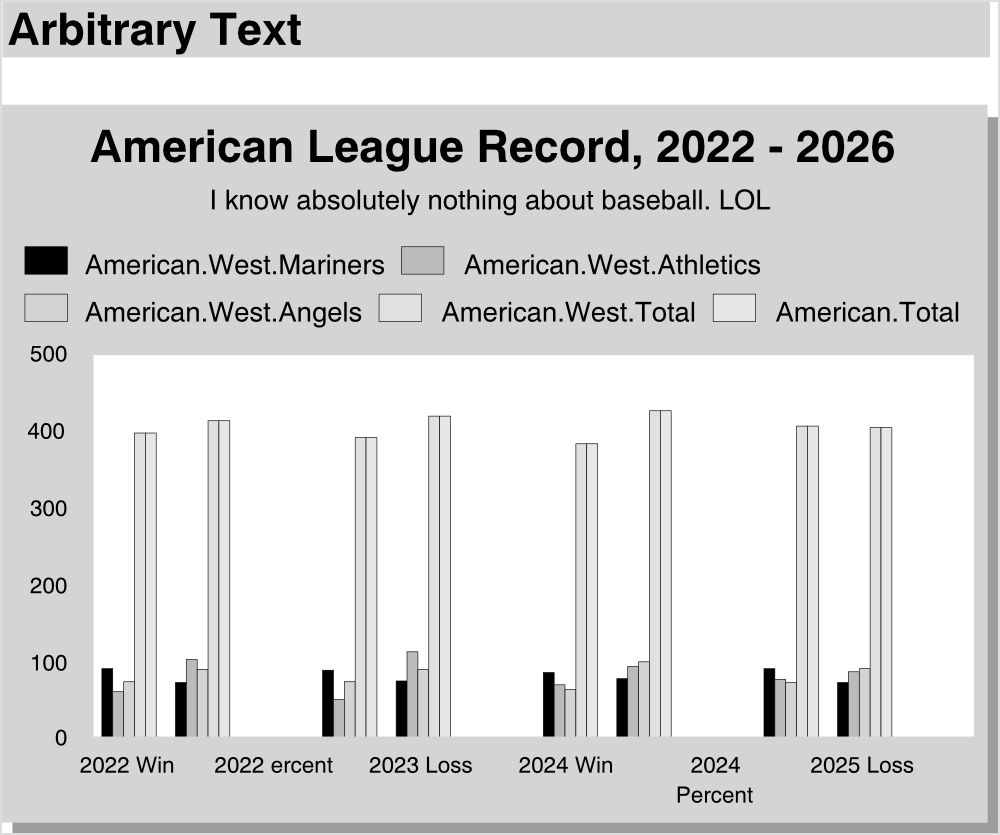
So it goes that while we have the tools to place arbitrary text on the page, yet lack tools to center that text, the sense that Lotus has overextended itself is strong. Sometimes it's enough to just generate the output a program excels at, and leave "page composition" to the professionals. Again, I need software to be more dumb. That's without even mentioning the plethora of formatting tools scattered amongst an unreasonable number of palettes, panels, and "inspectors."
A benefit of these tools on the NeXT is that everything we do is Postscript by default, thanks to NeXT's Display Postscript screen rendering engine. "Print" a document as PostScript, and we can render the resultant .ps file on any modern system. I opened it directly in Affinity and received precisely what I saw in Improv, chopped off text and all, but like, high-quality chopped off text.
In which the author clumsily lists off some annoyances
Look, I try my best to craft a compelling narrative, moving from topic to topic, stitching together callbacks and observations to lead you, my dear reader, on a carefully considered ride. It's just you and me, side by side at the keyboard, chatting about software and learning together. But, sometimes there's junk I need to squeeze in that I can't find a natural segue for discussing. Here, then, is a brain dump of other things I want you to know about Improv.
- There is no undo. This isn't the first program I've covered that lacked undo, and I'm not talking about software that can be forgiven for being born too early.
- The formula panel at the bottom applies formulas in the order shown. As order is important, it would make sense that you might want to rearrange them from time to time. There is no mechanism to do this, other than cut and paste. This has been more of a pain than the lack of undo.
- Improv uses special
PREVNEXTTHISkeywords to add cell relativity to formulas. So THIS value is the PREV value times 2, or whatever. But we're in a multi-dimensional sheet, so what do these keywords point to, precisely? Well, in a formula they must pick a category, and only that category can be referenced relatively. If a formula uses multi-dimensional data to calculate a value, likeSales Projection[THIS] = Years[PREV]:Region[THIS] * 1.178, those keywords won't work, though it would be completely natural to write such a formula and expect success. - There is no scripting. Lotus 1-2-3 users would have been particularly put out in not being able to bring their carefully built automation over to Improv, which would be a huge shocker since they're made by the same company. I would even go so far as to say that that alone would have pushed a great number of potential converts away. Nobody has the time to rebuild their financial empires from scratch!
- There are no 3D sheets, meaning there is no linking between projects. A project can contain up to 100 worksheets, and those worksheets can reference one another, but only within the same project file.
- If a category in a worksheet exactly matches a category in another, item for item, those can match and data will flow across as expected. Unfortunately, there is no way to synchronize the shared categories. Change the items in one sheet and those will not be picked up in sheets using that linked category. This means we cannot make a "master" category inherited by other worksheets. Like a lot of things back in the early days of productivity software, user diligence plays a large role in keeping things running smoothly. Even version 2 on Windows didn't add this feature. If only someone would step up to the challenge. (foreshadowing)
Speaking of version 2...
Improv 2.0
In 1993, NeXT abandoned its hardware initiative and moved over to Intel, rebranding as NeXT Software, releasing OPENSTEP soon after. At the same time, Improv also moved over to Intel, but parted ways with NeXT. With version 2, Lotus developers achieved the success that eluded them on OS/2, porting Improv over to Windows 3.1.
The feature set for version 2 is disappointingly similar to version 1, and by this time competing software was starting to embrace some of Improv's unique qualities. We do finally get undo, so thank Kapor for small favors. Scripting arrives in the form of LotusScript. A new Windows UI adds a bunch of buttons to the interface, and flushes the toilet paper dispenser for a more sensible list generator.
That's basically it for the new stuff, but at least they kept the old problems as well.
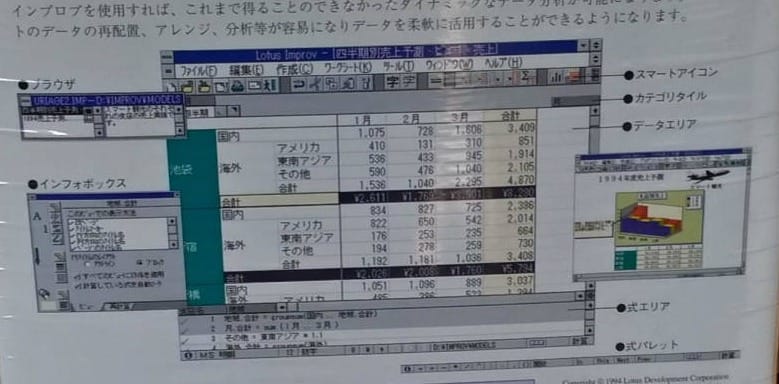
月:合計=sum(1月..3月)Cell reference relativity is still locked to a single dimension. Formulas cannot be freely rearranged, only cut-and-pasted into position. No 3D worksheets. Then, to throw a little extra wrinkle into the mix, there was Lotus's product strategy on the PC. If Improv wasn't your thing, maybe their other Windows spreadsheet, 1-2-3/Windows, would feel more comfortable. Or their other-other option, Lotus Symphony. Or their other-other-other option, Lotus Works. Or their other-other-other-other option, Lotus 1-2-3 for DOS Release 4, which went on sale in 1994.
Regardless, it was well-liked by the press, even if reviewers didn't seem comfortable giving full-throated endorsements. Take this Compute, July 1994, review for example.
"Improv is a whole new breed of program. Excel's pivot tables and Quattro Pro's Data Modeling Desktop mimic the ability to rearrange your data, but neither feature comes close to providing the power and flexibility of Improv's similar feature. You'll probably want to hang on to your regular spreadsheet for straightforward work with rows and columns, but get Improv to really explore the relationships in your larger models."
Or this PC World, February 1994, review.
"If you’re looking for a good all-purpose spreadsheet, Improv is not the answer. Improv is advertised as a spreadsheet, and it may look and feel like the other products in this comparison, but it is best described as a multidimensional data modeling tool. It’s not for everyone, but what it does, it does very well."
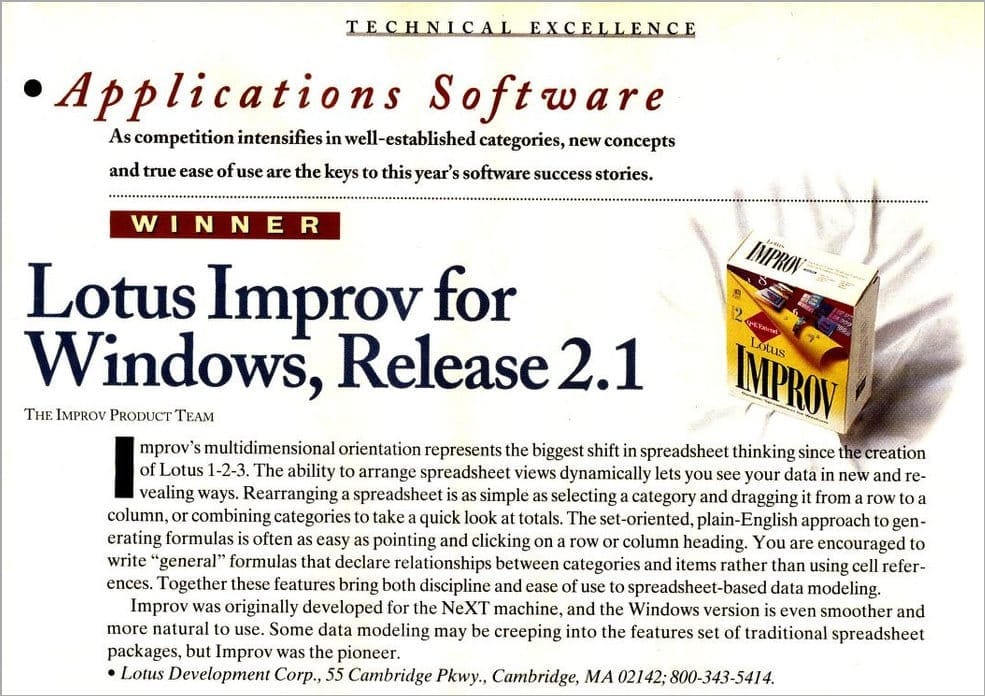
It would be hard to intuit, based on that review, that PC World had declared Improv the "Winner" in the Applications category for their 10th Annual Awards for Technical Excellence just a few months prior.
Improv 3.0
3 in spirit, if not in flesh; let's take a quick look at Quantrix, the product I clumsily foreshadowed earlier.
From ex-Lighthouse CEO (also ex-Sun CEO) Jonathan Schwartz's blog, "In 1989, a few friends and I started a software company, Lighthouse Design, that devoted itself to the NeXT platform. Whether any of us admitted it at the time, Lighthouse was built by a group of people for whom Steve Jobs was the gravitational center of the universe."
Their devotion to Jobs was returned in favor, by way of advice for their products to flourish on NeXT. Ultimately, according to Schwartz, the problem was less about finding a way for Lighthouse to flourish on NeXT than it was about getting NeXT to flourish in the first place. When looking for a buyout in Lighthouse's waning days, they had fingers crossed to be acquired by NeXT but Jobs didn't bite. They were bought by Sun, their products shoved in a vault never to see the light of day.
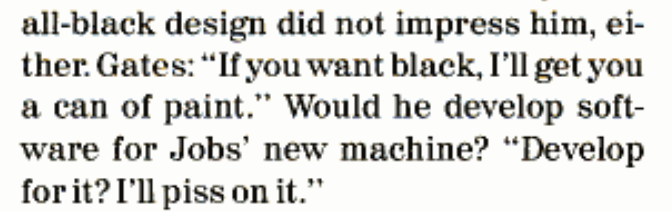
With Microsoft unwilling to support the platform, Lighthouse made the closest thing to an Office suite for NeXT. They built programming tools, project management software, a presentation tool called Concurrence (that Jobs used and which "inspired" Keynote), and two spreadsheet programs: ParaSheet and Quantrix.
ParaSheet took the more traditional approach, while Quantrix was just a flat-out clone of Improv, I don't know how else to say it. It has the same split screen worksheet/formulas, the same THIS NEXT PREV formula tools, the same draggable categories, it imports Improv documents, and more. According to one Hacker News reader, "The manuals were interchangeable."
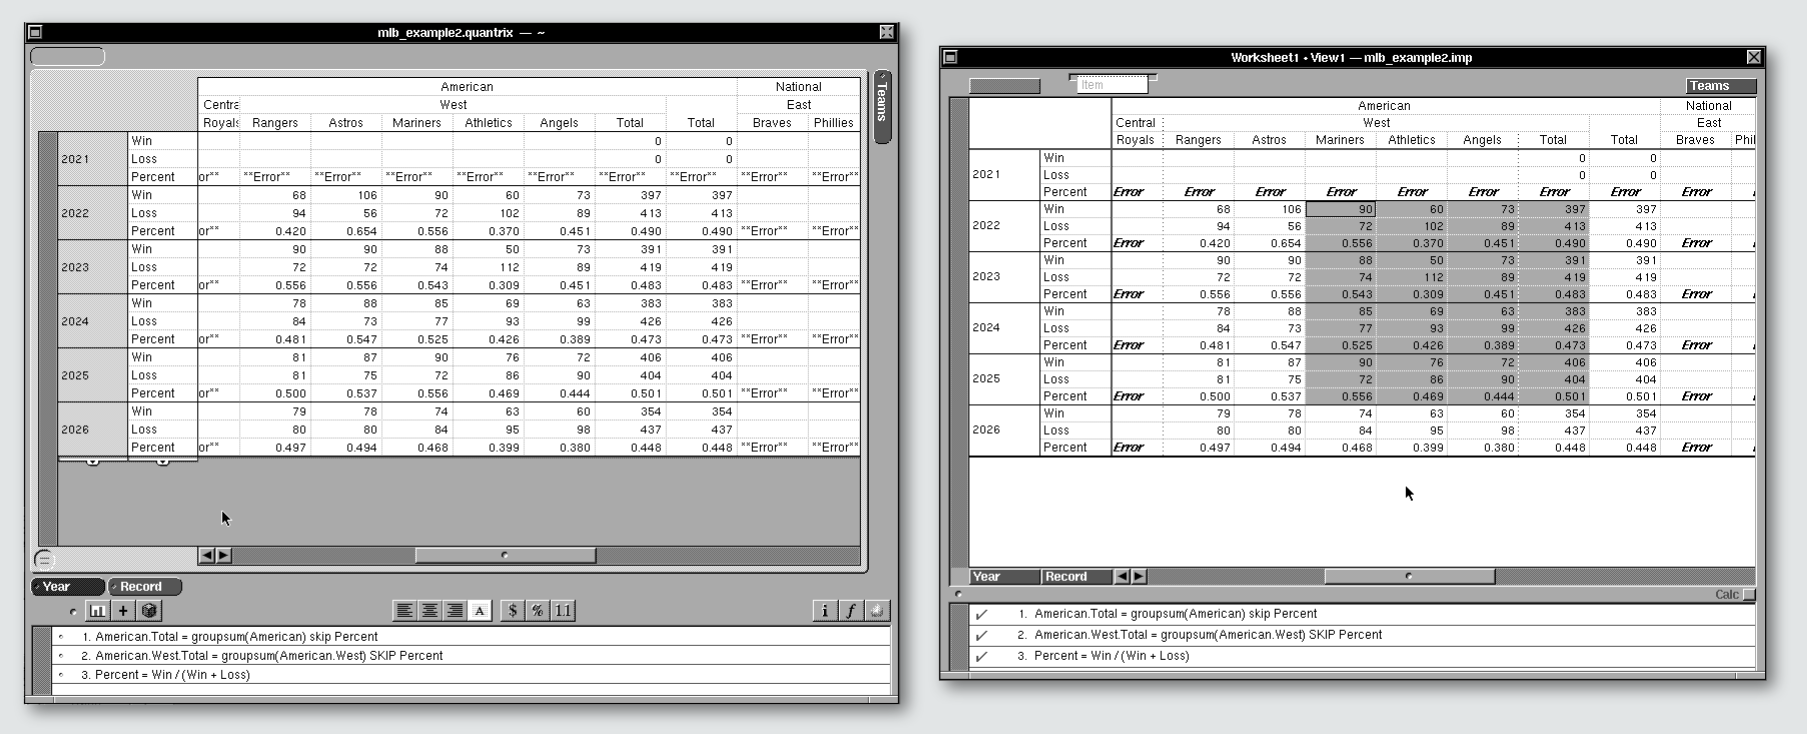
Lighthouse took the ideas behind Improv and ran with them, envisioning what a possible v3 could have been. Put simply, everything I've expressed frustration with in Improv is addressed in Quantrix.
It has undo. It has drag-and-drop, reorderable formulas. It has scripting. It has cross-worksheet category synchronization. The "Item Dispenser" is replaced with an in-line widget; pull to expand like any modern spreadsheet does today. It has multi-dimensional cell relativity. It runs on OPENSTEP for Intel, as well as NeXTSTEP on Motorola 68K . It has color. It loses contextual help (can't win 'em all). And that morass of panels and palettes for editing the charts I showed earlier? Those are collapsed into a single, tidy "Inspector."
Long story short? If you want to experience the best version of Lotus Improv today, use Lighthouse Quantrix v2.3. You'll get all of the original, cool tools built better, with a more sensible interface. Plus, Lighthouse gave away their NeXT applications, with license code, for free. How neat is that?
LightHouse Design, in the interest of helping their longtime users, is offering a free 2 user license for all Lighthouse applications excluding FrameMaker (only available from Adobe Systems, Inc.), OmniWeb (which already has a 1-user license) and JavaPlan (which is a currently shipping product).
- License note, circa 1997
Improv 4.0
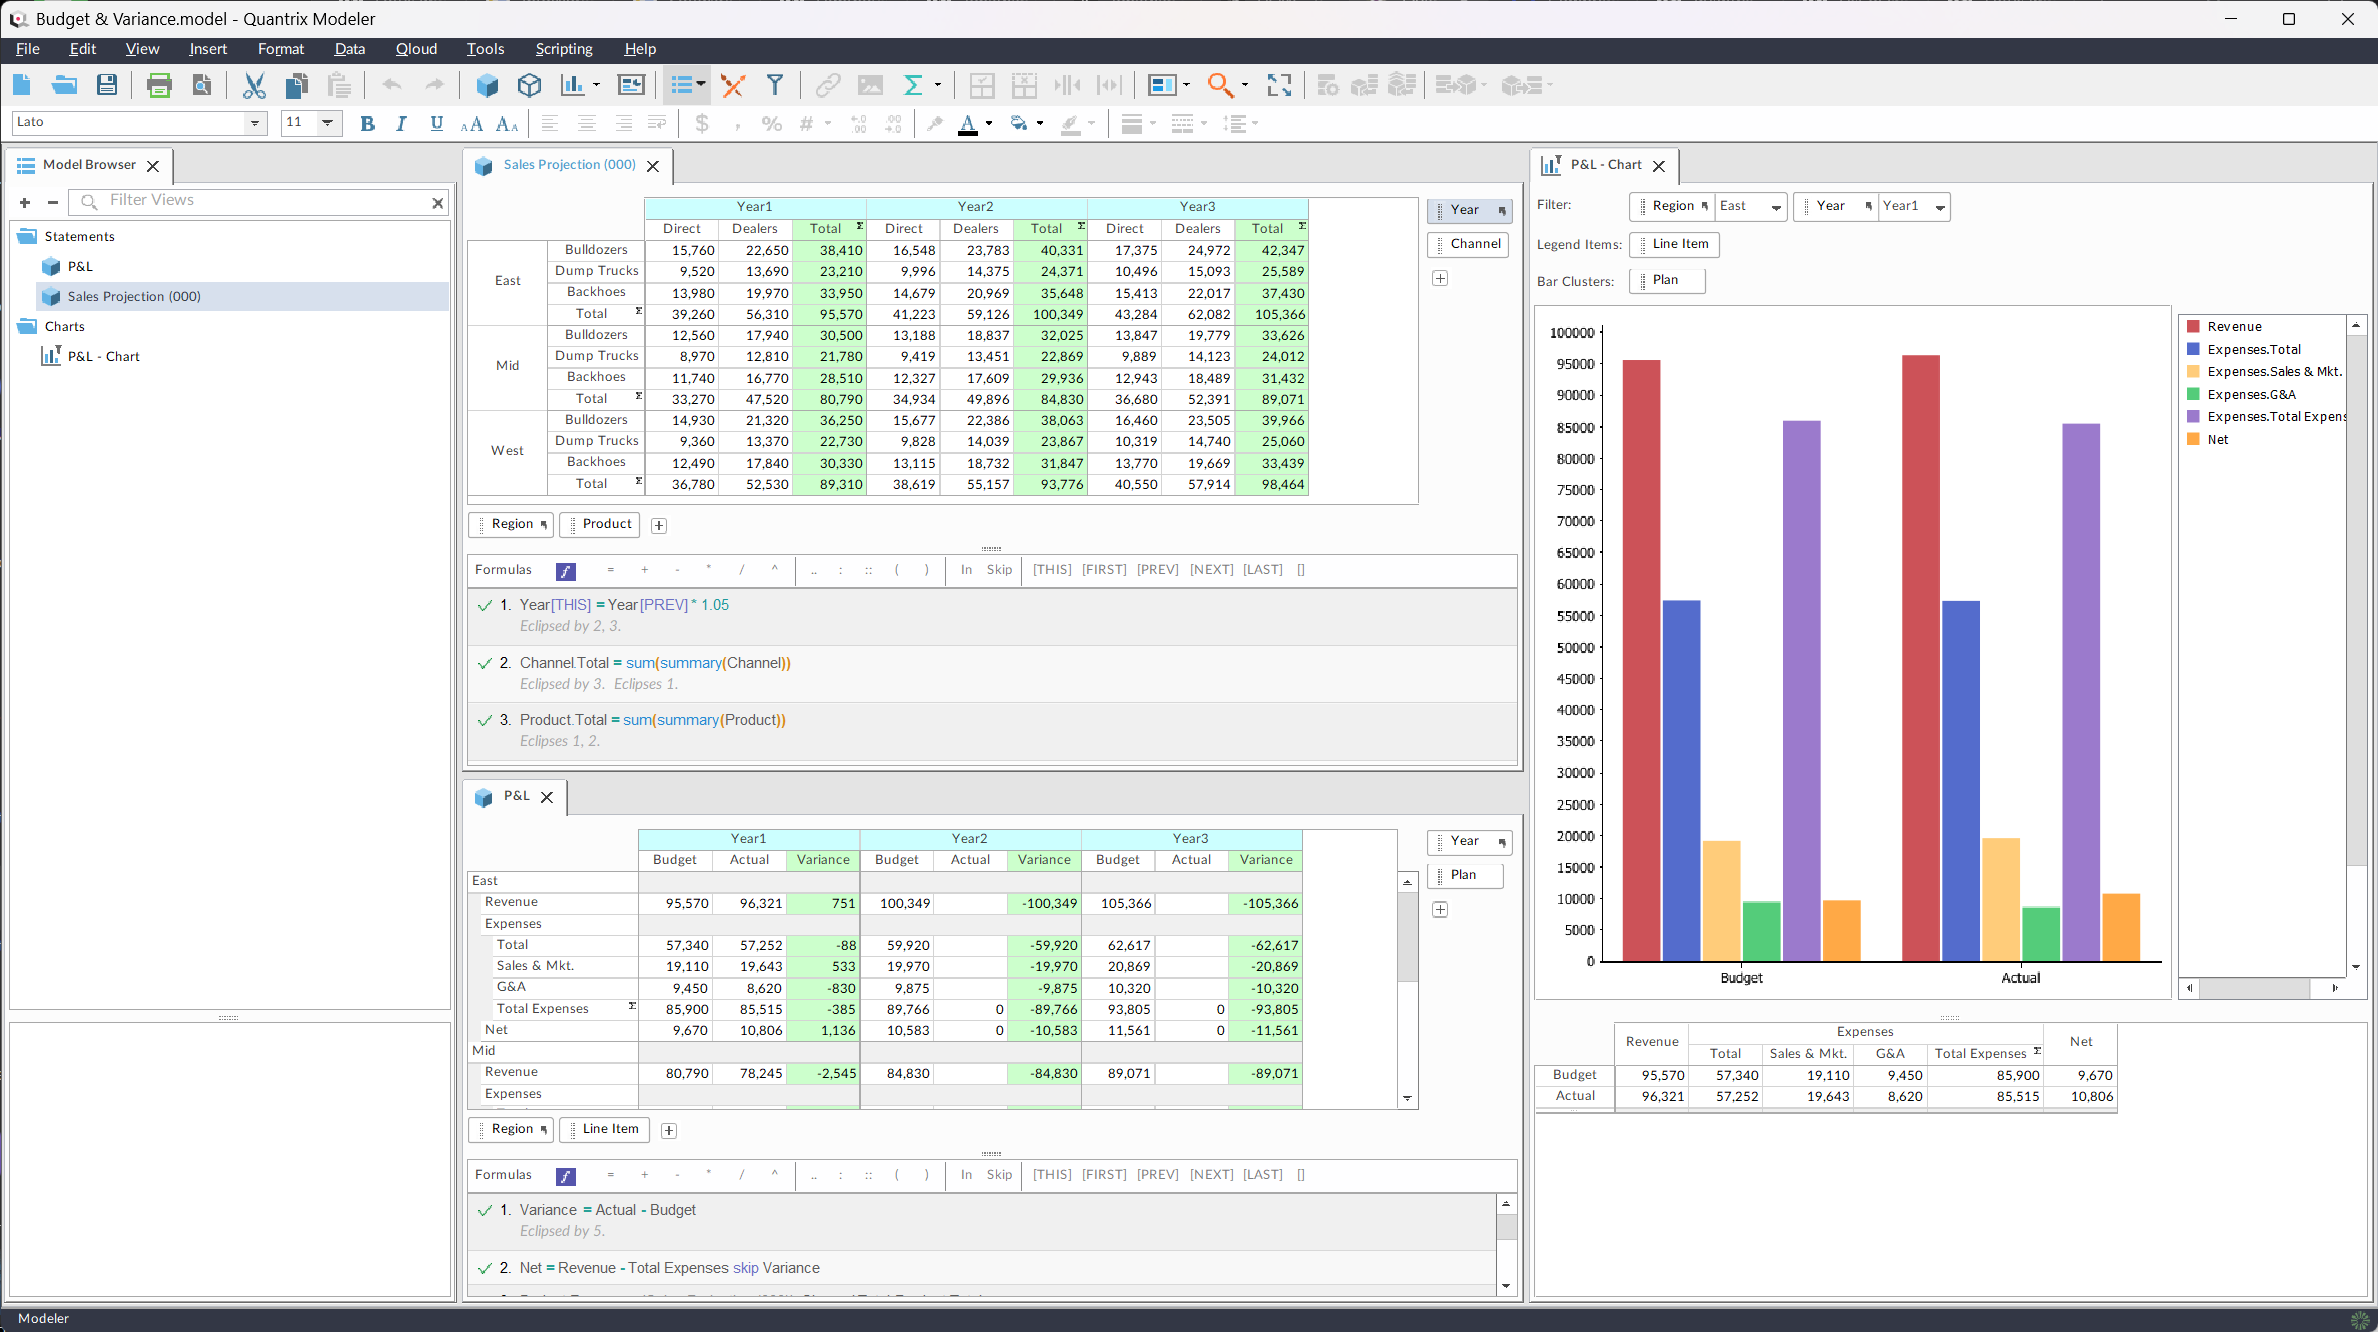
The big twist, for those affording me a generous definition of "twist," is that Quantrix still exists. It is alive and being sold for "ask for quote," so I think I'll just put this credit card back in my wallet at this time. Today, it very explicitly targets the professional, high-end, financial modeling crowd, and not the general-purpose masses. You know, the crowd that Lotus first showed their Back Bay prototypes to back in the day (see timeline). Its self-introductory video pivots (get it?) many of its 35-year-old features as revolutionary. A back-handed indictment of the stagnation of an industry, or a product finally finding its niche? You be the judge!
It's hard to suss out precisely what happened, but I found a little information floating around the Quantrix forums. If that is to be trusted, Lighthouse's Quantrix chief engineer, Pete Murray, founded the company Subx and rebuilt Quantrix as a Java application in 2003. Quantrix's website says it was acquired by IDBS in 2010. I'm still completely in the dark how Quantrix escaped Sun's containment field, as Sun had refused to sell off the Lighthouse apps to hungry buyers; that stuff could have been converted into OS X apps in the early days.
At any rate, it is one of the more handsome JRE applications, while suffering from telltale Java rendering issues, especially with regard to text positioning and scaling. Otherwise it is clean and inoffensive. Sterile? Boring. That's the word I was looking for: boring. "It knows its target audience," is perhaps more charitable.
Improv lessons
So where does this leave my relationship with Lotus Improv? Why did I dangle that "And yet..." at the start of the post? If I'm completely honest with myself, there is a vibrating tension between "wanting to love it" and "actually loving it."
After all of these weeks, I think I'm in a pretty good position to suggest why it didn't take the world by storm: it's not a great spreadsheet program. Let me qualify that statement lest r/Improv4Life roasts me alive; the roasting can wait a moment.
For what it does, it is amazing and even fun to use. What it doesn't do is provide a good, general purpose spreadsheet experience to the masses. It claimed to do that, positioning itself as the "NeXT generation of spreadsheets." Whatever Lotus Improv did or did not accomplish for the spreadsheet genre, one thing is for certain: it makes a fantastic tech demo.
Seen in that light, I'd have been as sold on it as Jobs was, excitedly showing it to NeXT non-believers, "Look what MY computer can do!" Those moments of smug technological superiority amongst friends are fun, aren't they? Once you played with it for a week or two, and the initial excitement of pivoting dulled, you may have ashamedly harbored a bit of buyer's remorse.
Adam Bosworth, in an article contemplating a talk he gave at ICSOC '04, was thinking about software complexity vs. simplicity, and posited:
Consider the spreadsheet. It is a protean, sloppy, plastic, flexible
medium that is, ironically, the despair of all accountants and auditors
because it is virtually impossible to reliably understand a truly complex
and rich spreadsheet. Lotus Corporation (now IBM), filled with
Harvard MBAs and PhDs in CS from MIT, built Improv. Improv set out
“to fix all this.” It was an auditor’s dream. It provided rarified heights of
abstraction, formalisms for rows and columns, and in short was truly
comprehensible. It failed utterly, not because it failed in its ambitions but
because it succeeded.
Paradoxically, Improv's promise to improve data comprehensibility wound up narrowing its general appeal. Want to quickly throw down a few lines of data, like a makeshift phone directory? You're gonna have to rethink your data as a matrix of abstract qualities about your friends. Despite its friendly English-like formulas and delightful GUI for pivoting data, Improv is in actuality purpose-built for far more rigorous data modeling than its playful tools suggest.
It's the next generation of spreadsheets for a thin slice of the market.
That said, there is a non-zero set of readers for whom their hardcore number crunching needs perfectly align with Improv's promises. If that's you, you're absolutely going to fall in love...
...with Quantrix.
Sharpening the Stone
Ways to improve the experience, notable deficiencies, workarounds, and notes about incorporating the software into modern workflows (if possible).
Emulator Improvements
- Previous never crashed on me, and has gotten a lot easier to set up since its early days. Version 4.4 has been great.
- For mouse movement, I found that setting (in Previous, not NeXTSTEP) "Slow movement" to "Fast" and "Fast movement" to "Slow" balanced things out to something close to consistent tracking; it worked for me, is all I can promise.
- There is a modern add-on to NeXTSTEP called "GKMouseScaler" that lets the user draw precise cursor acceleration curves, should you need better control. Personally, I never needed it.
- I found the 2-bit monochrome display to be more than sufficient; no color needed.
Troubleshooting
- This is version 1.0 of Improv and it did crash a couple of times, quite suddenly. There appeared to be no specific trigger, nor function, that led to the crashes. It just beachballed and died.
- NeXTSTEP itself felt stable to me.
- For installing software from modern repositories, three things to keep in mind
- Thanks to a convenience in Previous, at
root/Netin NeXTSTEP you can access your host computer file system. - You'll find a lot of .tar.gz files in the wild, so brush up on
gunzipandtar - Once you have a
.pkgfile, double-click and it should install itself.
- Thanks to a convenience in Previous, at
Interfacing with the Real World
Improv does export to Lotus 1-2-3, but you'll likely be disappointed with the results. Consider a table with formulas and calculated values in the cells. Everything you see in the cells will be exported, but there will be no formulas or relationships between anything. You will receive a snapshot of all current values, arranged to visually match the table structure you had when exporting. Improv's approach to shared formulas and multi-dimensional data simply don't have an elegant export solution to traditional spreadsheets.
If you have Improv documents you want to import into Quantrix, two criteria must be met. Save your Improv project as an .imx file (not the default .imp), and make sure you have the Lighthouse FilterServicer.service (available at the same site offering the Quantrix software link I mentioned under "Version 3") installed at ~/Library/Services.
Exporting charts is simplicity, thanks to Display Postscript. The Postscript files NeXTSTEP generates open and render just fine on modern machines, using Ghostscript or other graphics programs.
What's Lacking?
As mentioned previously, I actually recommend using Lighthouse Quantrix v2.3 instead of Lotus Improv, on the NeXT. The substantial features Improv lacks are numerous:
- No undo in v1 on NeXT; v2 on Windows does.
- Can't reorder formulas except through cut/copy/paste.
NEXTandPREVonly work along a single axis, even though it makes complete logical sense for them to work along multiple axes in the same formula.- Presentation Builder is overly complex on the one hand, yet missing very basic tools on the other hand.
- Can't reference values in other projects, aka no 3D worksheets.
- No scripting options in v1 on NeXT; v2 on Windows does.
In general, it's lacking the clay-like malleability of a traditional spreadsheet. If you're doing what a lot of us do, using spreadsheets like a kind of mini-database, you'll probably get frustrated.
Fossil Record
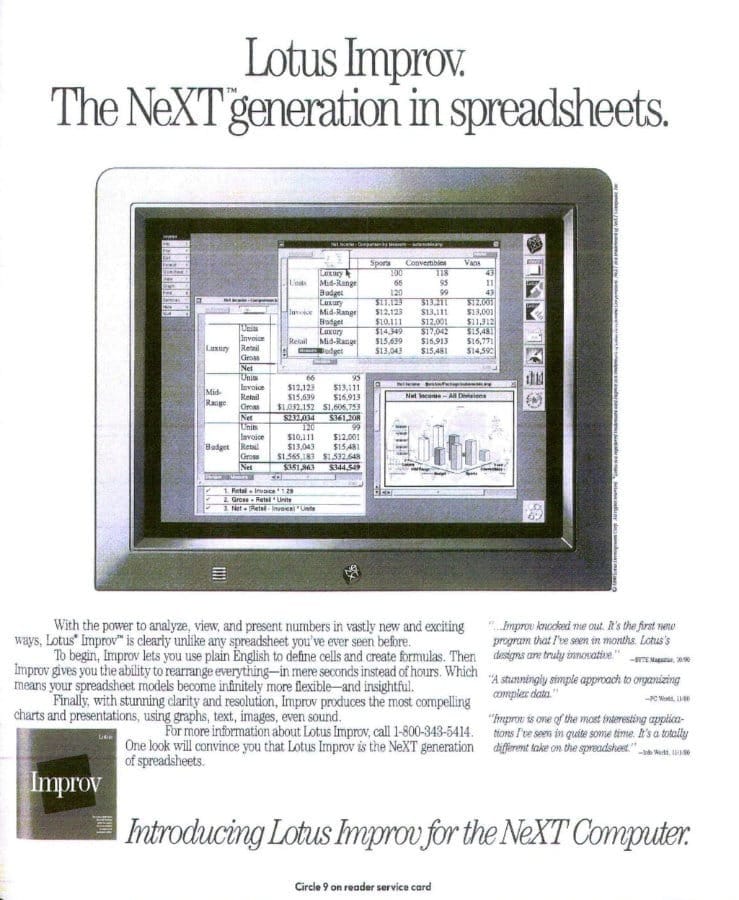
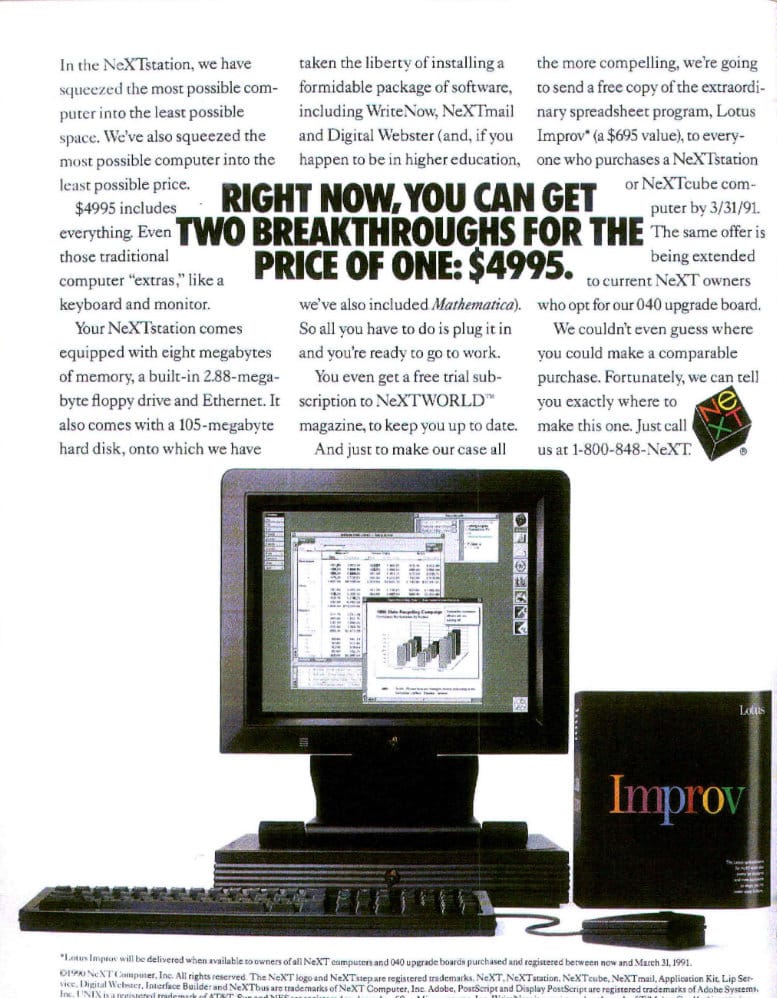

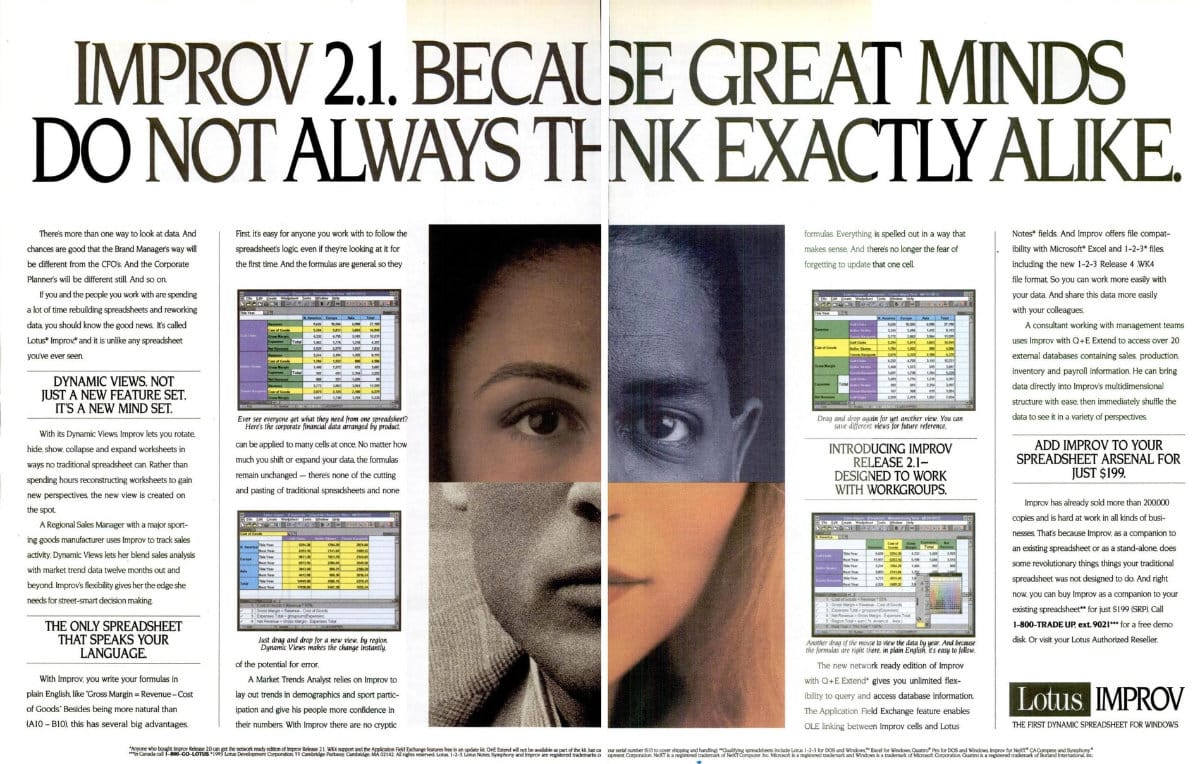
Here's the main event. Compare and contrast with his OS X announcement at MacWorld 2000 for bonus points.